

1. Introduction
2. Materials and methods
Study site and samplings
Growth
Production
3. Results
Population structure
Monthly variations in GSI and condition factor
Growth model
Production estimation
4. Discussion
1. Introduction
The ecological importance of seagrass as food source, nursery habitat and substrate stabilizers in estuaries and coastal areas throughout the world has been well documented (Klumpp et al. 1989; Haywood et al. 1995; Edgar and Shaw 1995; Rozas and Minello 1998; Connolly et al. 1999; Hemminga and Duarte 2000; Nagelkerken et al. 2002). The seagrass Zostera marina is widespread in shallow coastal areas of tropical and subtropical ecosystems (Klumpp et al. 1989). Vegetated seagrass meadows generally have a consistently higher diversity and secure abundance of vertebrates and invertebrates than other coastal habitats (Orth et al. 1984; Park and Kwak 2018). Seagrasses provide increased habitat structure, strongly influencing biotic interactions by regulating organism behavior, predator and prey encounter rates, reproduction, competition, and ecosystem function (Voigt and Hovel 2019).
Pholis nebulosa (family Pholidae), the tidepool gunnel, is an epibenthic teleost distributed widely throughout coastal waters around the Korean peninsula, known as one of the most common fish species in seagrass beds and rocky shores (Go and Cho 1997; Lee et al. 2000; Kwak et al. 2014). Recent studies of P. nebulosa extensively describe its morphology (Hur and Yoo 1983; Lee et al. 2000), taxonomy (Kim and Kang 1991), reproduction and early life history (Kimura et al. 1987, 1988a, 1988b; Kang et al. 1996), and feeding habits (Huh and Kwak 1997) in Korea and elsewhere.
The study area of Dongdae Bay is a body of water in the Korean Peninsula rich in seagrass beds that only recently has been influenced by human activities. The bay provides critical habitat for variety of invertebrates and juvenile fish. Of particular importance is the function of Dongdae Bay seagrass habitats in supporting larger, predatory fish, which are mostly of high commercial value (Park and Kwak 2018). Investigating the value of the seagrass habitats in supporting populations of P. nebulosa, therefore, may aid in devising regulations for habitat conservation and proper resource management, especially if assessed in light of production capacity expressed in the form of interactions between biotic variables, and population growth and mortality (Cusson and Bourget 2005; Dolbeth et al. 2008).
Measuring biomass of aquatic organisms is a primary tool in quantifying ecological investigations. Dry weight or ash-free dry weight is typically used as a proxy for energy contents of aquatic animals which represent energy transfer from producers to consumers (Weil et al. 2019), because an assessment of energy fluxes in ecosystems requires both the quantification of the consumer’s diets (Nielsen et al. 2018), and a determination of the energy contents of prey and predators (Cummins and Wuycheck 1971). In addition, an estimation of the amount of organic matter as food for higher trophic levels is given by the ash-free dry weight (Widbom 1984).
Generally, fish secondary production is region-specific. For example, reef habitats may enhance fish production by providing available habitats and elevating food resources, relative to nearby unstructured habitats (Peterson et al. 2003). It has been previously shown that production for Acanthogobius flavimanus in seagrass habitats was higher than in unvegetated adjacent habitats of Dongdae Bay (Kwak et al. 2009). The studies on fish production in Dongdae Bay have extended from assessing potential yield for fisheries management to include ecological characteristics of populations, such as feeding success according to distributional patterns of epiphytic algae for Pseudoblennius percoides and Hippocampus mohnikei (Huh et al. 2008; Kwak et al. 2008; Kwak 2009), furthering the understanding of such habitats for management from a resource conservation perspective.
The objective of this study was to estimate growth and production of P. nebulosa to supplement earlier studies assessing functional characteristics of fish assemblages in seagrass bed habitats. The results can be useful form as a prediction that seagrass beds support a greater abundance and number of species of fishes than adjacent unvegetated habitats. In addition, studies of fish production including multiple species may better contribute to the effectiveness of resource management and habitat conservation measures than single-species studies.
2. Materials and methods
Study site and samplings
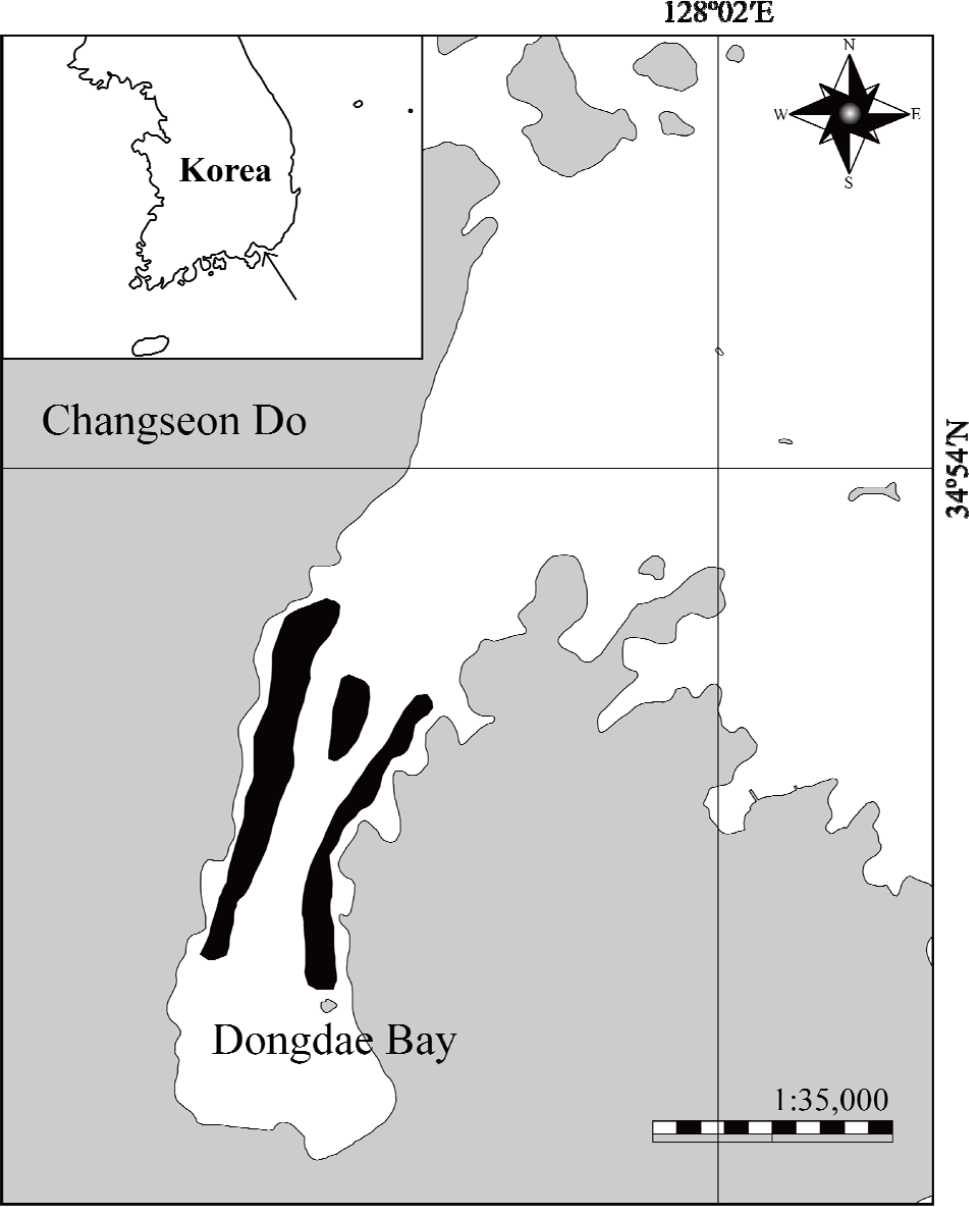
The study site of Dongdae Bay locates in the southern coastal waters of Korean Peninsula. In Dongdae Bay, seagrass forms subtidal bands about 3,000 m wide along the shoreline (Fig. 1). To estimate growth and production of P. nebulosa, samples on seagrass habitats were conducted using a 1.9 cm mesh wing and body, 0.6 cm mesh liner beam trawl. Sampling was carried out monthly during 2006 on spring high tides. Beam trawl sampling area was approximately 180 m2 per sampling event. The surface water temperature and salinity were also monitored during each sampling period.
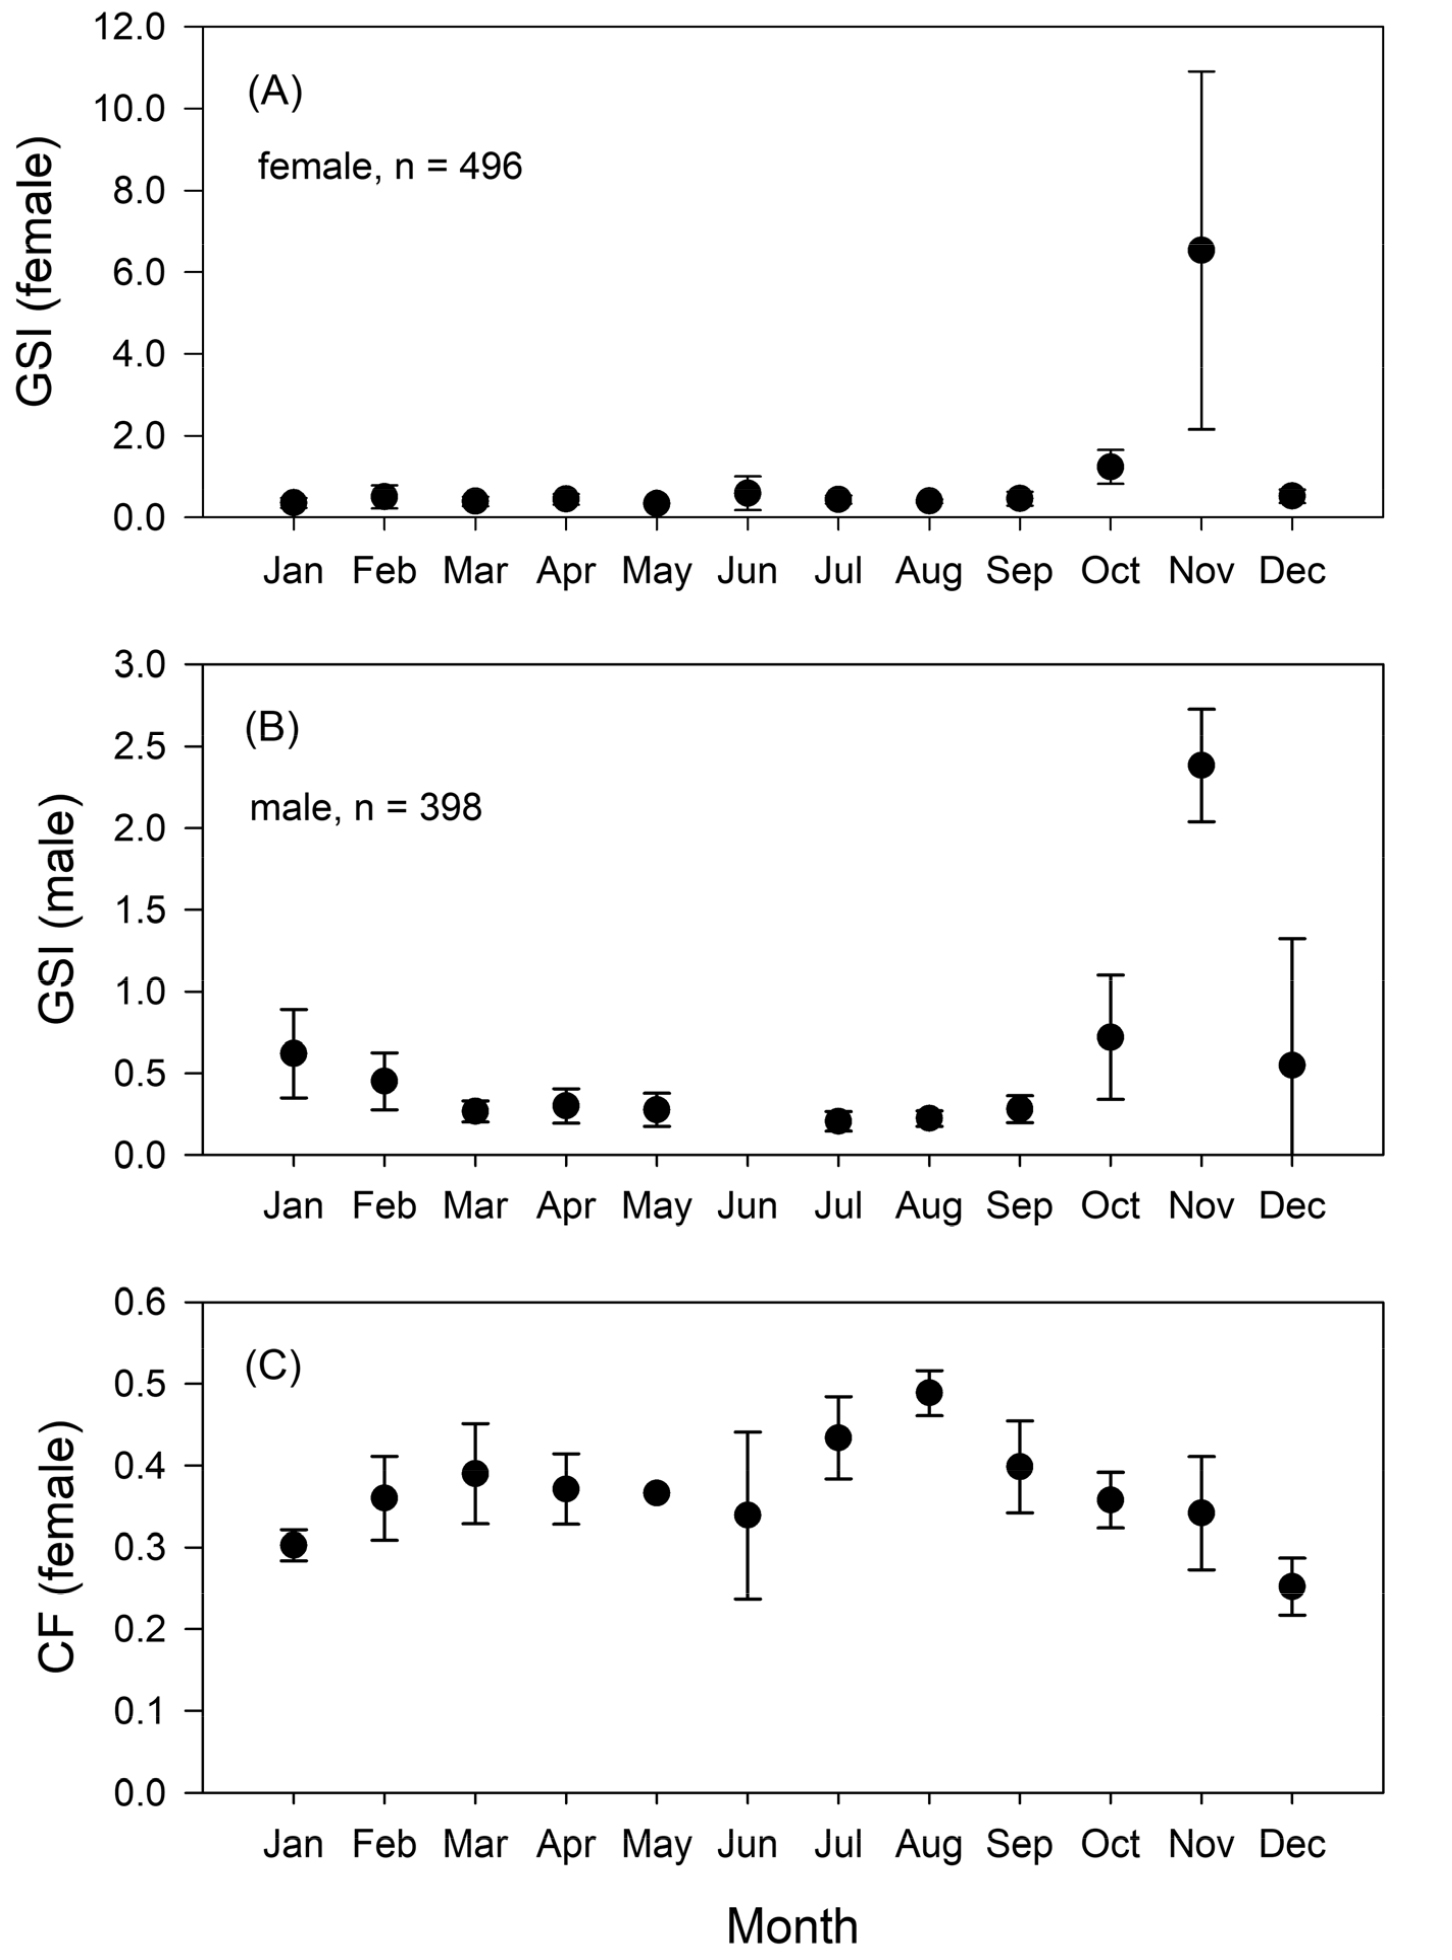
All fish samples were preserved in 10% buffered formalin immediately after capture. Total length (TL) and body weight (BW) to the nearest millimeter and 0.01g in the laboratory, respectively, were taken. Also, in the laboratory, the peritoneum of each fish specimen was excised, and the gonads removed and then weighed to the nearest 0.0001 g (GW). The gonadosomatic index (GSI) and condition factor (CF) were calculated as GSI = (GW/BW) × 100, CF = (BW/TL3) × 100. Sex was determined macroscopically by examining gonads. One-way analysis of variance (ANOVA) was used to assess monthly differences in GSI and CF values. Tukey’s post-hoc comparisons were used to assess whether there were significant differences of GSI and CF values among months.
Growth
Growth was used as a basis for determining production. Growth was estimated only for the year of sampling, providing increments observed within one year. Growth increments were estimated for each year-class cohort of fish. Cohorts were determined visually by investigating size frequency distributions obtained from successive sampling events. Size frequency distributions were constructed using 1 cm TL bins.
Length at age was assessed using three key parameters from von Bertalanffy growth model (on Bertalanffy 1938), described as Lt = L∞[1-e-k(t-t0)], where Lt is the length-at-age t, L∞ the maximum theoretical length, k is the body growth rate coefficient, and t0 is the theoretical age of the fish at zero length (Ricker 1975). von Bertalanffy growth equations were determined using the ELEFAN I routine in the FiSAT II software (Gayanilo et al. 2005).
Production
Production of P. nebulosa was calculated using mean daily length increments from the von Bertalanffy growth model. The production was estimated using the equation P = aBαTβ (a, α, β: coefficients) which relates daily fish production (P, g AFDW/day) with ash-free dry weight (biomass, B, in grams), and water temperature (T, in °C). The method was initially suggested by Edgar (1990) for estimating secondary production of benthic macrofaunal communities and then applied for calculating secondary and/or third production of marine animals thereafter (e.g. Edgar et al. 1994; Edgar and Shaw 1995; Bologna and Heck 2002). Also, annual fish production P (g AFDW/year) was estimated by multiplying daily fish production by 365. Daily fish production was calculated by dividing monthly production data by 30. To measure ash-free dry weight for each specimen, individuals were dried for 2~3 weeks at 80°C and weighted to the nearest 0.0001g. Individuals were then burned to ash at 500°C for a minimum of 4 h to obtain ash weight. Ash weight was subtracted from the dry weight measurement to get the ash-free dry weight for each individual. Regression analysis of natural log-transformed data was used to determine the equations describing the relationship between total length and body weight, and ash-free dry weight for each species or species group (Gould 1965; Burton 1998). Where multiple specimens of same length were used in determining ash-free dry weight, their mean value was used in the regression analysis. A one-way ANOVA was used to analyze variations in density, biomass, and production between months.
3. Results
Population structure
The number of individuals of P. nebulosa ranged from 20 (August 2006) to 256 (March 2006) individuals. Abundance was highest in March and April 2006, with a minor peak in September 2006.
Monthly variations in GSI and condition factor
The mean GSI and Cf values varied significantly with month (P < 0.05, ANOVA, Fig. 2). The mean GSI values of both male and female were lower during spring and summer and began to increase in October, reaching the highest level in November and decreasing thereafter (ANOVA post-hoc test, Fig. 2A and 2B). Spawning took place primarily from October to November. The mean seasonal values of condition factors were lower in winter (January and December), but showed higher values in summer (from June to August) indicating better body condition before commencing spawning (ANOVA post-hoc test, Fig. 2C).
Growth model
Pholis nebulosa lengths ranged from 3.8 cm TL to 25.5 cm TL (n = 894). January 2006 size frequency distributions showed modes at 14.0 cm TL, 16.0~21.0 cm TL, and 24.0 cm TL. New cohorts with individual fish lengths ranging from 3.3 cm TL to 8.2 cm TL first appeared in May 2006 (Fig. 3).
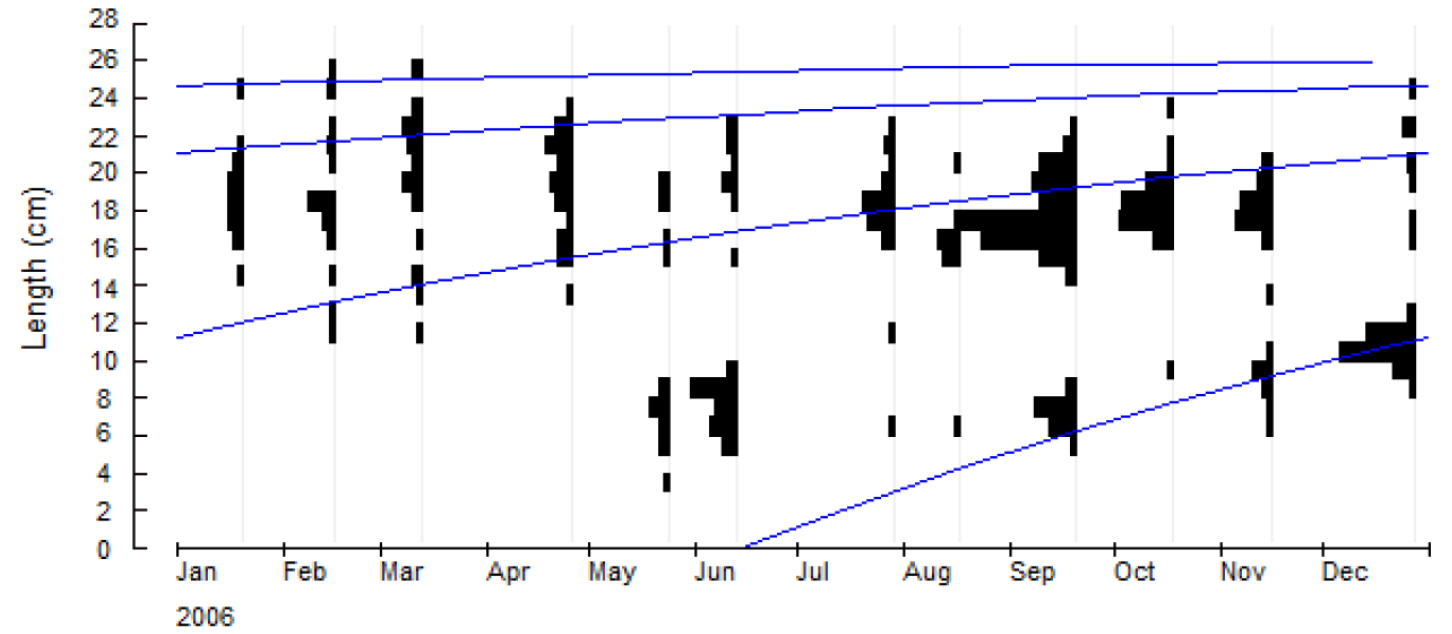
Distinct cohorts (0- to 3-year cohort) were apparent during study period, with easily recognizable size frequency peaks (1 cm TL classes) between successive samplings (Fig. 3). One-year cohort was at 11~14 cm TL, 2-year cohort at 16~22 cm TL, and 3-year cohort at 24~25 cm TL in January 2006 and February 2006. The 1-year cohort was observable almost monthly, showing a growth from 11~14 cm to 16~20 cm TL by December 2006. For the 2-year cohort, growth was from 18~22 cm TL in June 2006 to 22~24 cm TL by December 2006. Zero-year cohort recruited at 3~9 cm TL in May 2006 and grew to 8~12 cm TL by December 2006.
Body weight statistically significantly increased with total length (R2 = 0.9868, p < 0.001). The length-weight relationship was constructed over the length range 3.83~ 25.5 cm TL, obtaining the W = 0.0013TL3.3748 equation. The variation in total length showed differences with time (TL = 8.8177 Ln(d)-39.9713, R2 = 0.94, p < 0.001, Fig. 4A), with the average growth rate of P. nebulosa estimated to be 7.8 cm TL for the 0 year cohort, 15.6 cm TL for the 1 year cohort, 19.5 cm TL for the 2 year cohort, and 23.9 cm TL for the 3 year cohort, following cohort analysis (Fig. 4B). The von Bertalanffy’ growth model (1938) for P. nebulosa, was estimated as Lmax = 28.3823 cm TL; t0 = -0.9864 year-1; k = 0.7835 year-1.
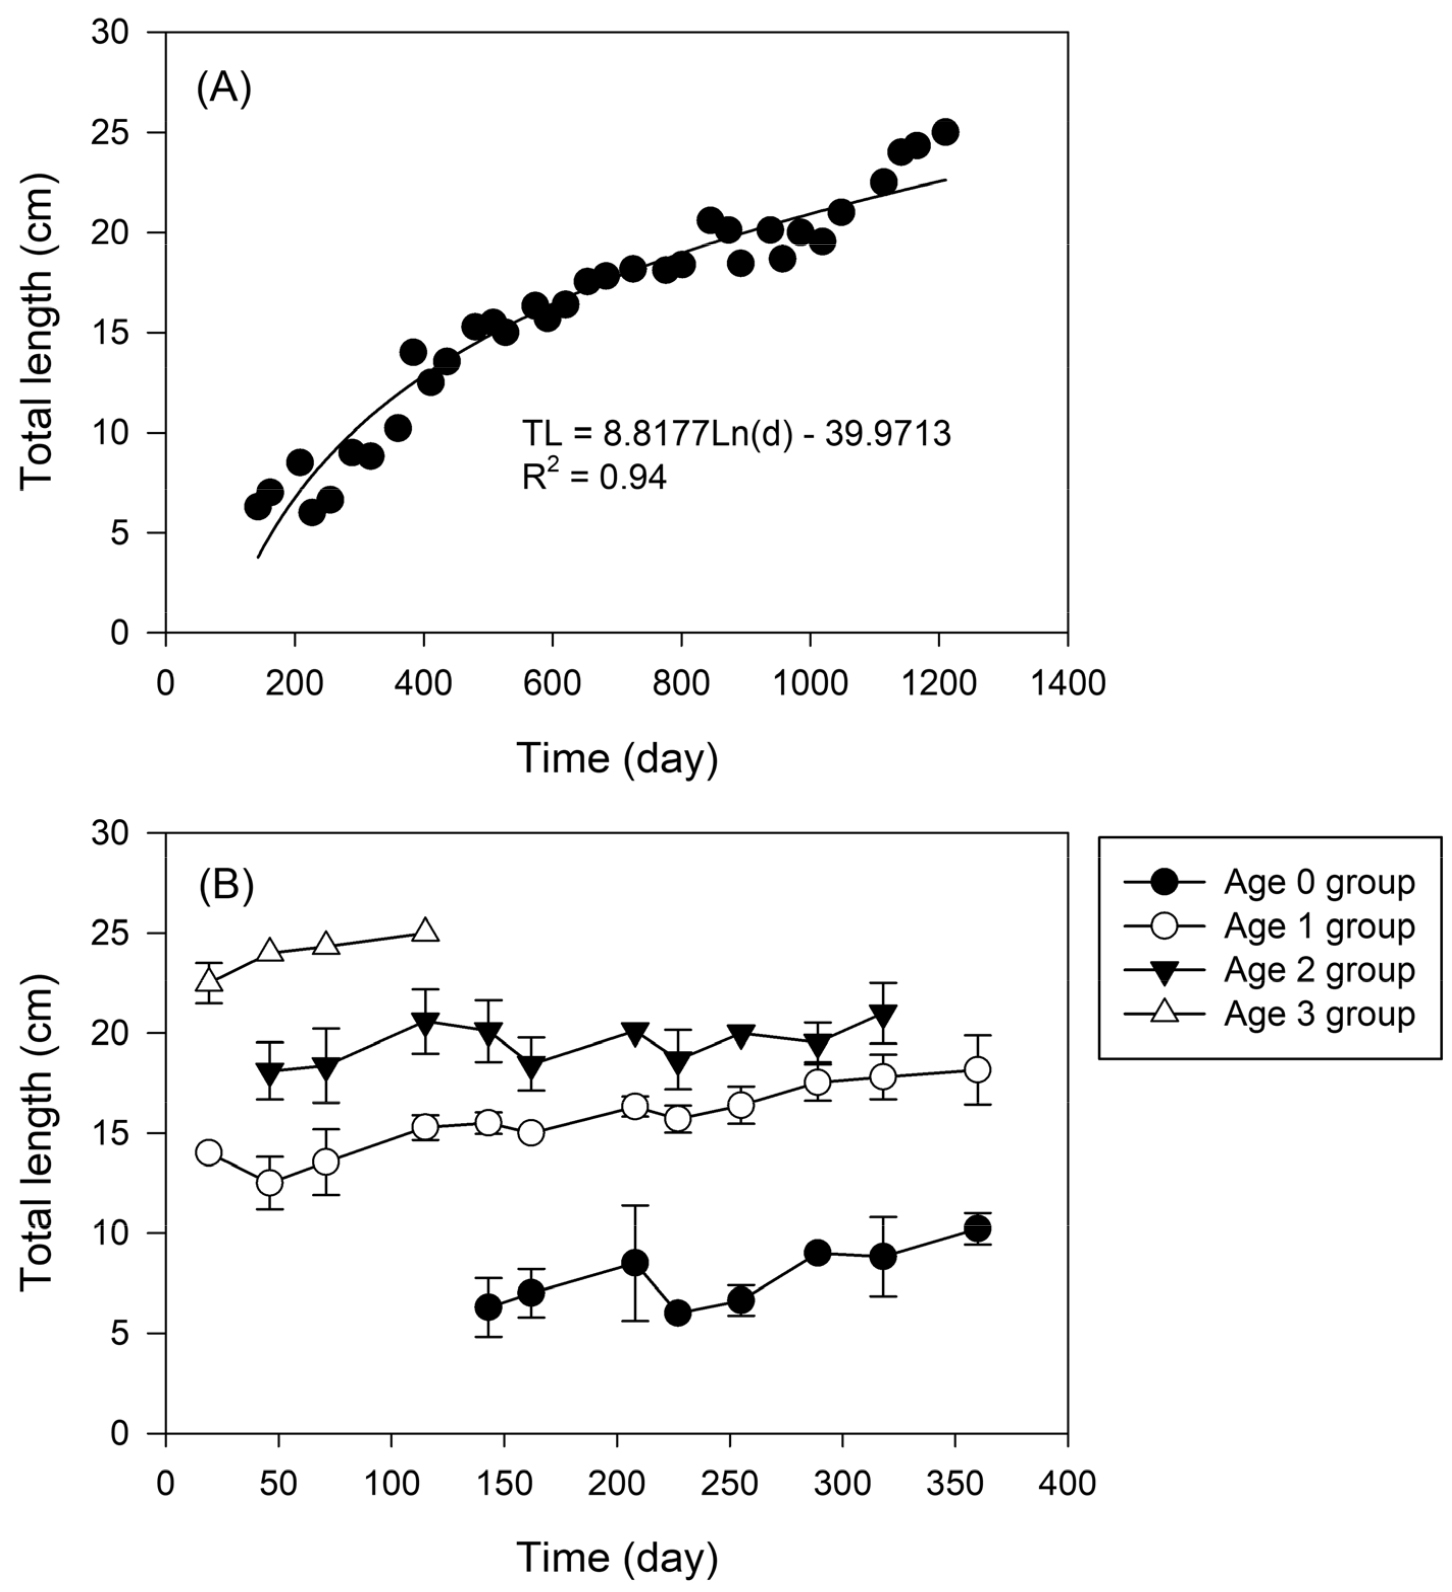
Following back calculation in growth of P. nebulosa, values for length and weight at age were L1.0 = 11.04 cm TL, L2.0 = 15.71 cm TL, L3.0 = 19.12 cm, TL, L4.0 = 21.62 for total length, and W1.0 = 4.25g, W2.0 = 13.97g, W3.0 = 27.09g, W4.0 = 40.95g for weight. Back calculation was obtained from cohort analysis going back 3 years.
Production estimation
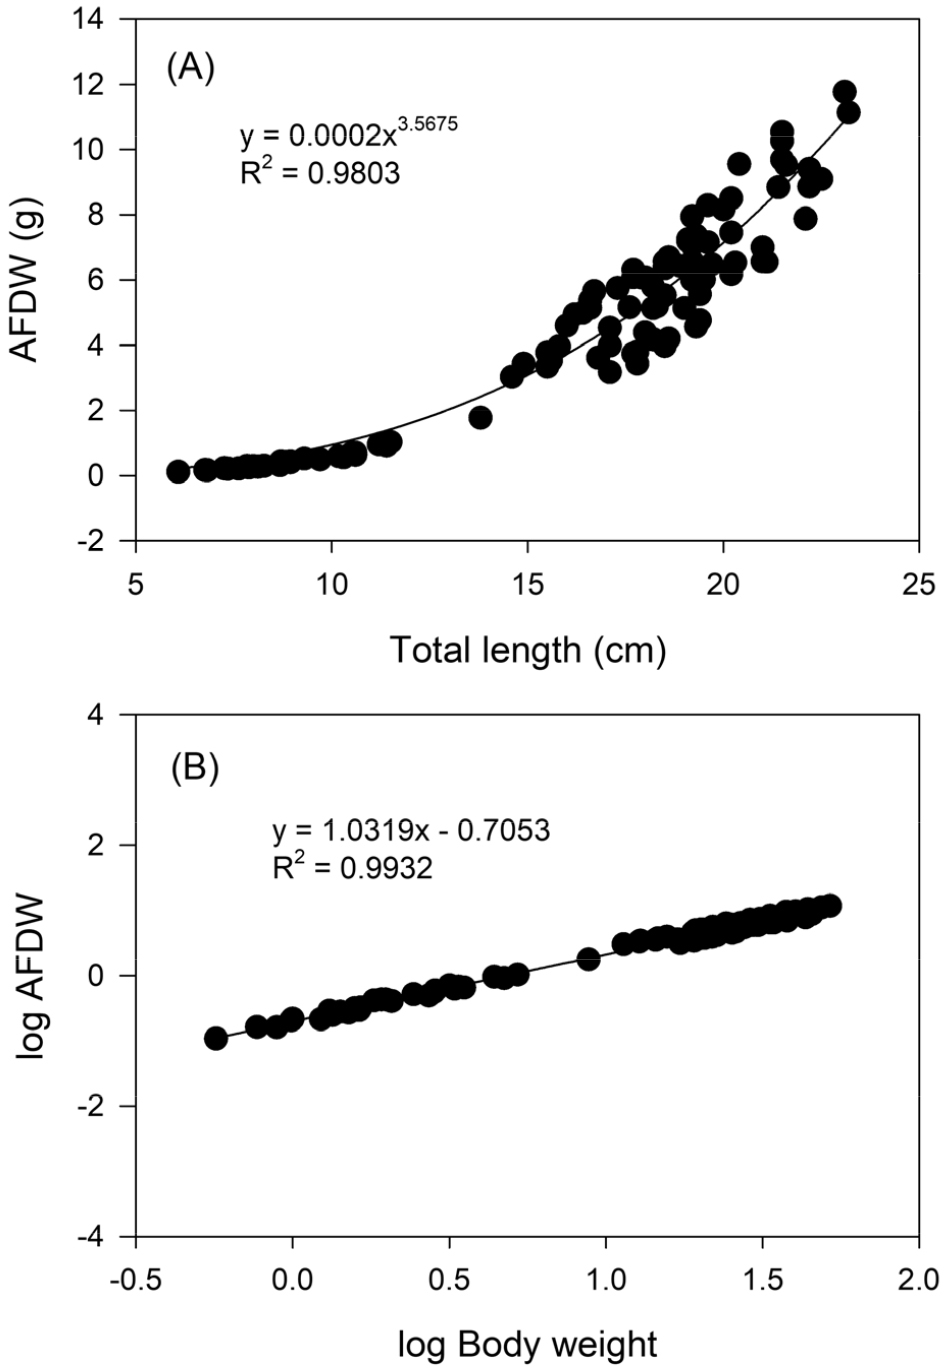
The relationships between total length and ash-free dry weight (AFDW) were estimated as AFDW = 0.0002TL3.5675 (R2 = 0.9803; Fig. 5A) and between log-transformed body weight and AFDW were AFDW = 1.0319logBW-0.7053 (R2 = 0.9932; Fig. 5B). Daily growth rate, estimated from monthly AFDW values divided by 30, was calculated as AFDW/day = 0.0008B1.5467 (R2 = 0.8488). The production of P. nebulosa thus was estimated as P = 0.0016B0.8468T0.5942.
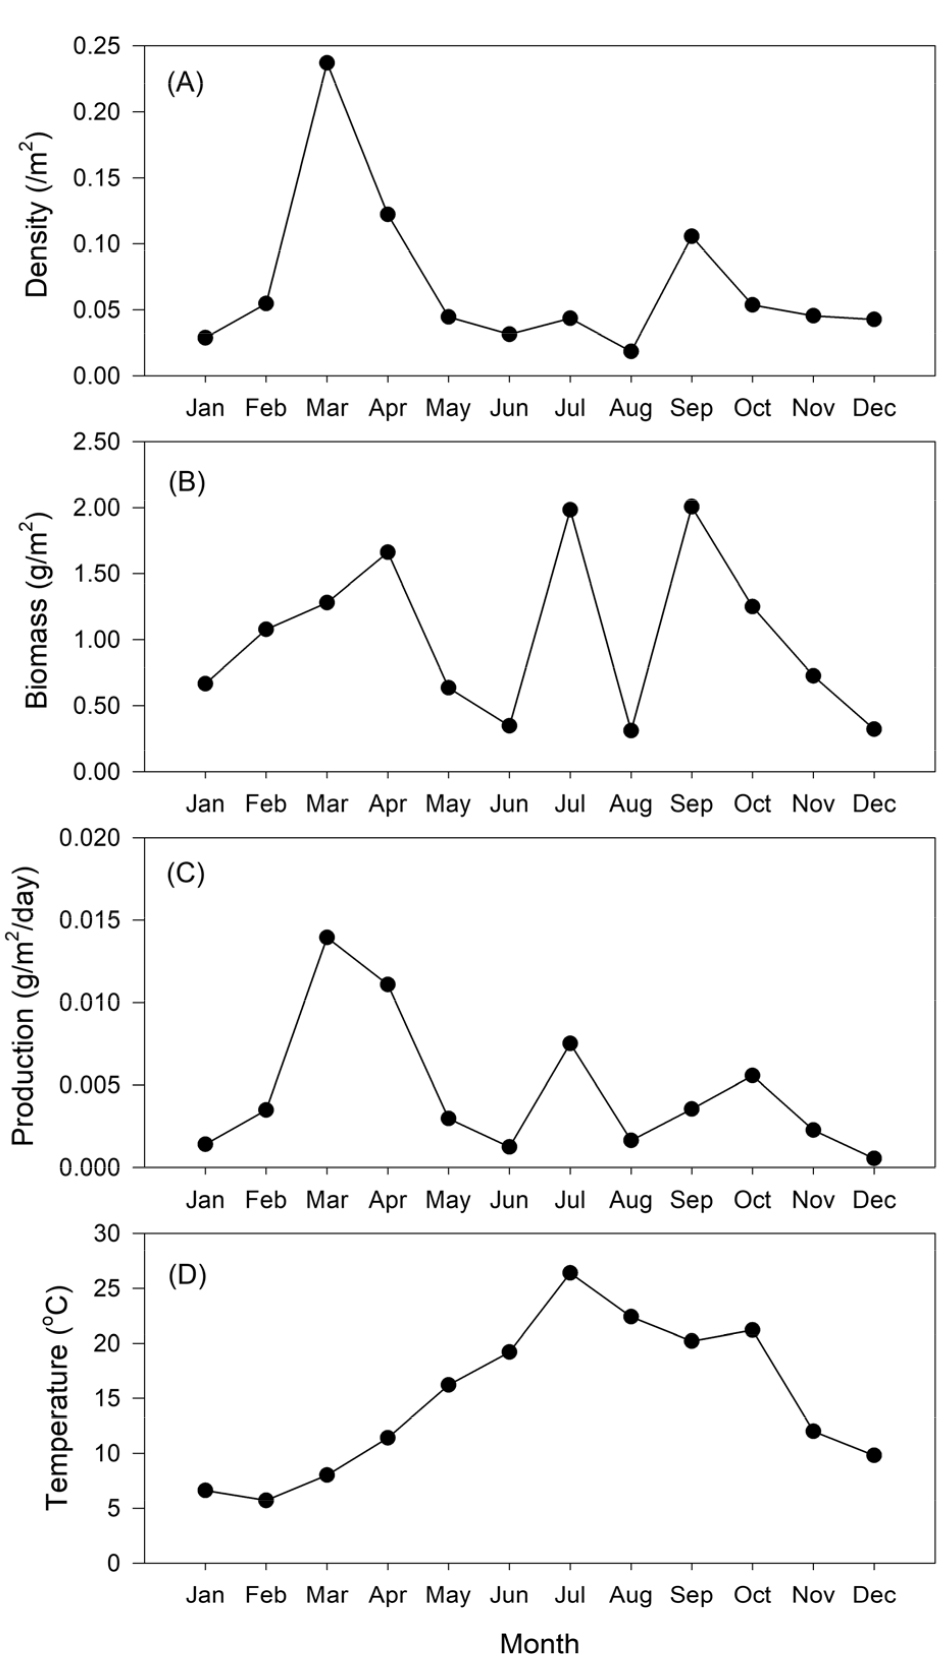
Water temperature ranged from 6.6°C to 26.4°C, showing the highest value during July and lowest during January (Fig. 6D). The density (/m2) showed an overall average of 0.069±0.061/m2. Density differed substantially between months, with significantly higher values in March 2006 (0.24/m2), April 2006 (0.12/m2), and September 2006 (0.11/m2; ANOVA, P < 0.05; Fig. 6A). Biomass showed an overall mean of 1.022±0.621 g/m2, with significantly higher values in April, July, and September 2006 (1.66, 1.98, and 2.10 g/m2; ANOVA, P < 0.05; Fig. 6B). Overall daily production (g AFDW/m2/day) was 0.005±0.004 g AFDW/m2/day, with significantly higher values between March and April 2006 (0.0139 and 0.0111 g AFDW/m2/day; ANOVA, P < 0.05; Fig. 6C). The average annual production, and P/B were 1.676 g AFDW/m2/year, and 1.641, respectively.
4. Discussion
This study is the first to provide density, growth, and production of P. nebulosa in a seagrass bed. Estimation of fish production accuracy has been provided for short time intervals relative to the dynamics of the fish and for populations of large sizes (Hemminga and Duarte 2000; Nagelkerken et al. 2002), demonstrating large variations in accuracy. Accuracy variation is partly due to variations in recruitment and fluctuations in migration rates in and from fish populations. Pholis nebulosa is the most abundant species in local seagrass beds, comprising more than 70% of total biomass of the whole fish community (Kim 2010). Estimates of daily production have been determined worldwide based on growth increments and monthly temperature following the method of Edgar and Shaw (1995). In all studies, accuracy of production estimates has fluctuated, yet their ecological importance remains. Our study, due to the large biomass contribution of P. nebulosa, reveals important ecological mechanisms for seagrass environments in coastal Korea.
The P. nebulosa population dominated over the study periods with monthly variation in number of individuals. Smaller individuals first appeared in May and June 2006, with most of individuals larger during the remaining periods. Individuals larger than 10 cm TL, however, were always present during study periods. Because Pholidae species live within seagrass habitats during whole their lifecycle, these patterns were mostly due to variations in spawning and recruitment throughout the life span of our target species. Length frequency analysis as well as the overall pattern from GSI and condition factor data, however, indicated that smaller individuals of P. nebulosa would recruit in May from spawning events during November and December in the previous year. Our observations were in agreements with other studies showing most individuals of P. nebulosa spawning during lower temperature months, between November and January (Kimura et al. 1987; Kang et al. 1996). Kang et al. (1996) showed lower growth rates from otolith data for P. nebulosa between November and December, coinciding with the spawning periods for that species. Most of temperate fish species essentially stop growing after maturation, resuming rapid growth rates after spawning. In addition, high condition factors before starting breeding season may reflect high energy reserves for future spawning activities (Trippel and Neil 2004).
Compared with those of P. nebulosa in other areas, growth rates for fish in this study were little lower. Few comparable studies were conducted in a seagrass bed of other areas worldwide. For example, L1.0 = 13.24 cm TL, L2.0 = 15.43 cm TL, L3.0 = 18.22 cm TL, L4.0 = 20.40 cm TL, L5.0 = 21.78 cm TL, and W1.0 = 10.18g, W2.0 = 18.72g, W3.0 = 36.20g, W4.0 = 56.67g, W5.0 = 73.54g were reported in the coastal waters off Gadeok Island, Korea and maximum total length reported to be 33.8 cm in a tide pool of Ago Bay, Japan with BW = 3.5351 × 10⁻⁴ × TL3.9745 (Kimura et al. 1987; Kang et al. 1996). This difference may be attributed to differences in environmental factors, such as habitats (seagrass beds vs. non-vegetated area), sampling periods (2006 vs. 1980~1982 and 1990~ 1991), and methods (cohort vs. otolith analysis). For example, microhabitat structure and complexity, as well as density of prey organisms are typically higher in seagrass beds than in non-seagrass areas, which could account for the observed differences. Because fish growth is strongly related to the environment, such as temperature and food availability, variations in most ecosystems are expected (Connolly et al. 1999; Hemminga and Duarte 2000; Nagelkerken et al. 2002; Diana 2004).
There were considerable monthly variations in production of P. nebulosa observed in this study, with highest production in March and April 2006. Analyses including number of individuals, growth rate and production showed significant positive correlations with eelgrass biomass, while those showed negative correlations with water temperature (P < 0.05; Park and Kwak 2018). Alternatively, density was not correlated with production (P > 0.05). These patterns are similar to those observed for A. flavimanus, Sebastes inermis, Aulichthys japonicas, Psedoblennius cottoides, and Synganthus schlegeli occurring in this study’s area (Kwak et al. 2009; Kim 2010). In the study area, mean abundance of fish assemblage was significantly higher at seagrass habitat and during spring when eelgrass biomass was the highest, but not corresponded with water temperature (Park and Kwak 2018). Therefore, fish density consequently fish production looks not correlated with water temperature at least in seagrass habitats. Also, the specific growth rate and production of fish species was highly correlated with the ratio of liver weight to total weight, which may be used as indicators of growth rates (Cui and Wotton 1988; Diana 2004).
Daily and annual production of P. nebulosa was higher (0.005 g AFDW/m2/day and 1.676 g AFDW/m2/yr) than that of A. flavimanus (0.001 g AFDW /m2/day and 0.351 g AFDW/m2/yr) at unvegetated areas nearby at our study sites. Acanthogobius flavimanus production values, however, were similar in a seagrass bed of Dongdae Bay (Kwak et al. 2009). For productivity of P. nebulosa, P/B (1.64) was also higher than those for A. flavimanus, S. inermis, A. japonicas, and P. cottoides in our study area (Kwak et al. 2009; Kim 2010). The dominance and high production of P. nebulosa could be resulted from the high food availability for P. nebulosa in the study area. Higher food availability for P. nebulosa has also been reported in other studies, where it has been observed that the species mainly feeds on amphipods (gammarids and caprellids) occurring on the blades of seagrasses (Huh and Kwak 1997).
Production of P. nebulosa in this study was higher than that reported elsewhere for temperate and subtropical seagrass fish communities. The result might have been due to higher seagrass productivity, consequently higher prey densities supporting higher production of P. nebulosa in the study area. Several other studies have shown that many fishes species, including P. nebulosa, prefer seagrass beds for feeding and nursery habitats (Huh and Kwak 1997; Kwak et al. 2006; Kim 2010). Seagrass beds, therefore, may support larger numbers and higher production of P. nebulosa, due to its diversity of prey organisms for fish species, making these habitats of ecological and economic importance not only for Korea, but likely worldwide.
