

1. Introduction
2. Material and Methods
Treatment of the Macroalgal Substrate Samples and Microscopic Counting of the EPD Cells
Morphological Groups and Surface-to-volume Ratio of the Substrate Macroalgal Species
3. Results and Discussion
Morphological Groups vs. Surface-to-volume Ratio of the Substrate Macroalgal Species
Heterogeneous Distribution of Total Epiphytic Dinoflagellates in Substrate Macroalgal Samples
Average Number of EPD Genera in a Substrate Macroalgal Sample vs. EPD Abundance
Distribution of Epiphytic Dinoflagellate Genera in Various Substrate Macroalgal Species
Epiphytic Dinoflagellate Abundances in Relation to the Morphology of Macroalgal Hosts
Ostreopsis and Gambierdiscus Abundances in Relation to Habitat Temperature and Salinity
4. Conclusion
1. Introduction
Marine benthic dinoflagellates inhabit diverse environments (Hoppenrath et al. 2014) such as sandy sediments, coral rubbles, mud flats, and surface of seaweeds and seagrass substrate, the last of which is the habitat for epiphytic dinoflagellates. Among the 5 major epiphytic genera of benthic dinoflagellates, Prorocentrum was firstly described by Ehrenberg (1834), followed by Amphidinium (Claparède and Lachmann 1859), Ostreopsis (Schmidt 1901), Coolia (Meunier 1919), and then lastly Gambierdiscus (Adachi and Fukuyo 1979).
In the Far Eastern Seas, the benthic dinoflagellate genus, Sinophysis, was first described by Nie and Wang (1944). Along with the previous taxonomic studies of Gambierdiscus toxicus gen. et spec. nov. in the French Polynesia Gambier Islands (Adachi and Fukuyo 1979; Yasumoto et al. 1977), taxonomic and toxicological studies of benthic dinoflagellates in coastal waters of Japan have begun (Fukuyo 1981; Nakajima et al. 1981). Ostreopsis in the East Sea was first reported from samples collected in Russian Ussuriiskii Bay (Selina and Orlova 2010), where the species diversity of epipsamic (Selina 2008) and epiphytic (Selina and Levchenko 2011) dinoflagellates as well as the classification of other dinoflagellate species belonging to Amphidinium (Selina and Hoppenrath 2008) and Sinophysis (Selina and Hoppenrath 2004) were also reported previously. The occurrence of epiphytic dinoflagellates (EPDs) was first reported among Korean seas by Kim et al. (2011) based on the quantitative analysis of the EPDs in macroalgal substrates around Jeju coasts in 2009. Subsequently, a series of the Korean coastal EPD monitoring (Park et al. 2020; Oh 2015; Jang 2013; Shah et al. 2013; Baek 2012), strain-based taxonomic and ecophysiological studies (Jang et al. 2018; Shah et al. 2016; Yoo et al. 2015; Lee et al. 2014; Jeong et al. 2012), exploration of novel marine natural products from mass-cultured EPD strains (Lee et al. 2020, 2019; Hwang et al. 2018; Yang et al. 2017; Hwang et al. 2013) were performed (Yih et al. 2019).
Spatiotemporal heterogeneous distribution of EPD species was recognized as being influenced by habitat complexity including the morphological diversity of substrate macroalgal species (Boisnoir et al. 2019; Parsons et al. 2011), the temperature and salinity of ambient seawater (Berdalet et al. 2017Berdalet et al. 2017; Bomber et al. 1988), and the water depth of the habitat (Lee et al. 2020; Yong et al. 2018). The morphological diversity of the host macroalgae and the associated substrate preference of the EPDs (Boisnoir et al. 2019) can partially reflect the huge variable surface-to-volume ratio (SA/V ratio) among diverse macroalgal species (Vasechkina and Filippova 2019; Nielsen and Sand-Jensen 1990). Four to six morpho (functional) groups of macroalgae were characterized based on morphological types and SA/V ratios (Vasechkina and Filippova 2019; De los Santos et al. 2009; Wallentinus 1984). Substrate specificity expressed as a SA/V ratio may affect the epiphytism of the benthic dinoflagellates with higher epiphytic biomass on a host substrate of a higher SA/V ratio (Gémin et al. 2020; Okolodkov et al. 2007; Lobel et al. 1988). However, no quantitative study on the relationship between EPD abundances and the SA/V ratio of diverse substrate macroalgal species was available so far.
Here, we re-analyzed the distribution pattern of EPD species from macroalgal samples collected around Jeju coasts in 2009 (Kim et al. 2011) with special reference to the SA/V ratios of macroalgal substrates for the first time.
2. Material and Methods
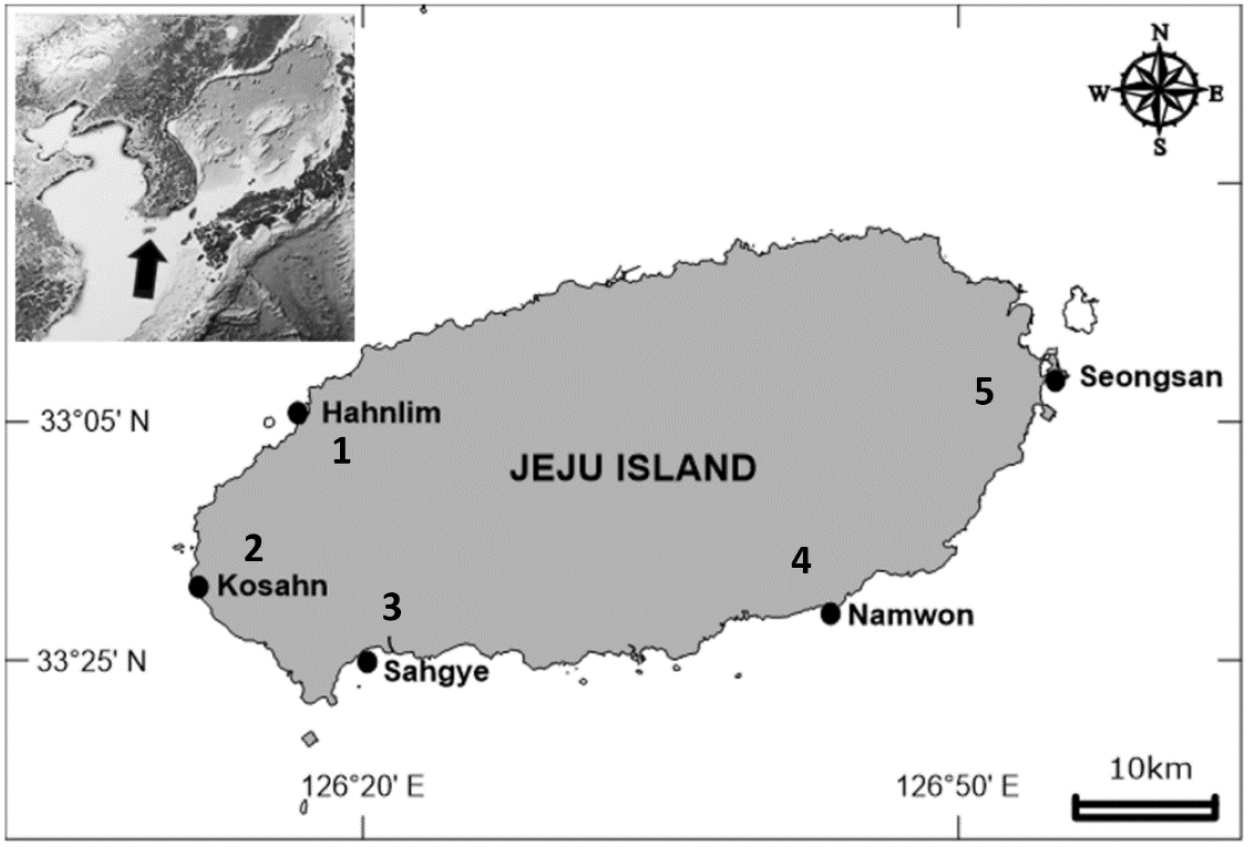
The method for collecting and processing of the EPD samples has previously been described elsewhere (Kim et al. 2011). Briefly, abundance of EPDs were determined from 45 macroalgal samples belonging to 24 species. On October 30 and November 1, 2009, samples were collected at depths of 1 to 3m water depth at 5 stations around Jeju Island, Korea. Of the five stations, Sahgye and Namwon are located at south side of the horizontal axis with Kosahn at west end and Seongsan at east end of Jeju Island along with Hahnlim, the northwestern station (Fig. 1).
Treatment of the Macroalgal Substrate Samples and Microscopic Counting of the EPD Cells
The macroalgal substrate was sampled underwater using a plastic bag, then fixed with buffered 3% formaldehyde in the laboratory and shaken vigorously to isolate the dinoflagellate cells, and finally filtered through 500 μm Nitex mesh to obtain a dinoflagellate filtrate. The dinoflagellate abundance was then determined by direct cell counting under a light microscope (Zeiss AxioCam HRc5, Carl Zeiss Ltd. Göttingen, Germany) using a Sedgwick- Rafter counting chamber. EPDs belonging to five genera (Amphidinium, Coolia, Gambierdiscus, Ostreopsis and Prorocentrum) were examined and counted to obtain abundance data per unit mass of the host macroalgae (cells (gram wet weight)-1).
Morphological Groups and Surface-to-volume Ratio of the Substrate Macroalgal Species
For each of the 24 different macroalgal species derived from the 45 substrate samples (Kim et al. 2011) the species- specific SA/V ratio and morphological group (MG1 to MG6) were determined (Table 1). The SA/V ratio was directly adopted from literatures, or arbitrarily assigned to with approximated value by referring the previous report for the taxonomically-close species (Nielsen and Sand-Jensen 1990; Wallentinus 1984). Six morphological groups (MGs) chosen from earlier works (Wallentinus 1984; Vasechkina and Filippova 2019; De los Santos et al. 2009) were applied to the 24 macroalgal species. The six MGs include MG1- Sheet form (thin tubular and sheet like or foliose), MG2- Filamentous form (delicately branched), MG3-Coarsely branched form, MG4-Thick leathery form (thick blades and branches), MG5-Jointed calcareous form (articulated calcareous), and MG6-Crustose form (encrusting).
Table 1.
Surface-to-volume ratios (SA/V ratios) and morphological groups (MGs) of the 24 species of macroalgal substrates (MG1-Sheet form (thin tubular and sheet like or foliose), MG2-Filamentous form (delicately branched), MG3-Coarsely branched form, MG4-Thick leathery form (thick blades and branches), MG5-Jointed calcareous form (articulated calcareous), and MG6-Crustose form (encrusting))
3. Results and Discussion
Morphological Groups vs. Surface-to-volume Ratio of the Substrate Macroalgal Species
Of the 24 macroalgal substrate species, 9 species belonged to MG3 with an average SA/V ratio of 100.0. The other MGs were with 1 (MG5 and MG6), 3 (MG2), 4 (MG4) or 6 (MG1) macroalgal species (Fig. 2a). The average SA/V ratio for each MG is marked as a bar in Fig. 2. The highest SA/V ratio was in MG2 (filamentous or delicately branched group), and then followed by MG1 (thin tubular and sheet like (foliose) group) (Table 1). The maximum (Fig. 2b) as well as average (Fig. 2a) SA/V ratio for each MG generally decreased as the MG moves from MG2 to MG6, where MG1 was with lower average SA/V ratio than MG2.
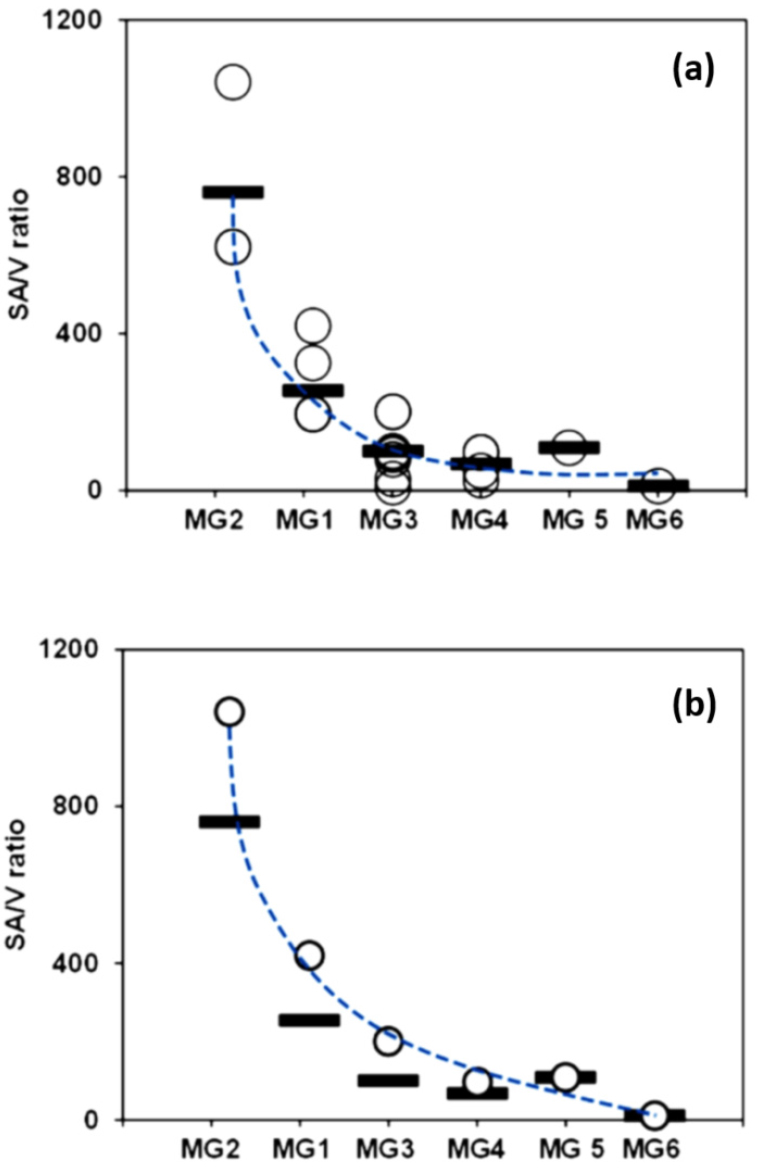
Fig. 2.
Scatter plots showing the surface-to-volume ratio (SA/V ratio) of the substrate macroalgal species in the plane of MG (morphological group) and SA/V ratio axis. (a) All the 24 macroalgal species are scattered as empty circles. (b) Maximum SA/V ratio for each MG is marked as an empty circle. The average SA/V ratio for each MG is marked as a horizontal bar
Rates of photosynthesis and nutrient uptake have been known to have positive relationship with SA/V ratio or the structural gradient across functional morphological groups of diverse macroalgal species. The SA/V ratio of macroalgae was explored as a quantitative measure of functional morphology in relation to physiological rates such as primary production, nutrient uptake, and net growth (Gacia et al. 1996). Across the functional form groupings (from “leathery”, “bladed”, to “finely branced”) of macroalgal species, SA/V ratio and biomass-specific net photosynthesis increased significantly (Stewart and Carpenter 2003). The generally decreasing pattern of the SA/V ratio of the substrate species across the six functional morphological groups (MGs) in the 24 macroalgal substrate species (Fig. 2) matches well with the other related works on the rates macroalgal ecophysiology. Thus, it would be worthwhile to firstly explore the quantitative distribution pattern of EPD genera in relation to the SA/V ratio or across the six MGs of the 24 substrate macroalgal species from Jeju coasts.
Heterogeneous Distribution of Total Epiphytic Dinoflagellates in Substrate Macroalgal Samples
Five EPD genera were examined and counted for each of the 45 macroalgal samples belonging to 24 species (Table 1 and Fig. 3). Codium fragile (macroalgal species 24 in Fig. 3a) was the only species that gave no EPDs. The sum of the EPD abundance from the top two macroalgal substrates species, Derbesia sp. and Martensia sp. (macroalgal species 1 and 2 in Fig. 3a) with SA/V ratio of 1042 and 420, respectively (Fig. 3b), accounted for 47.6% of the total EPD abundance from the 45 substrate samples, and the sum from the top 6 substrate samples accounted for 71.3% (Fig. 3).
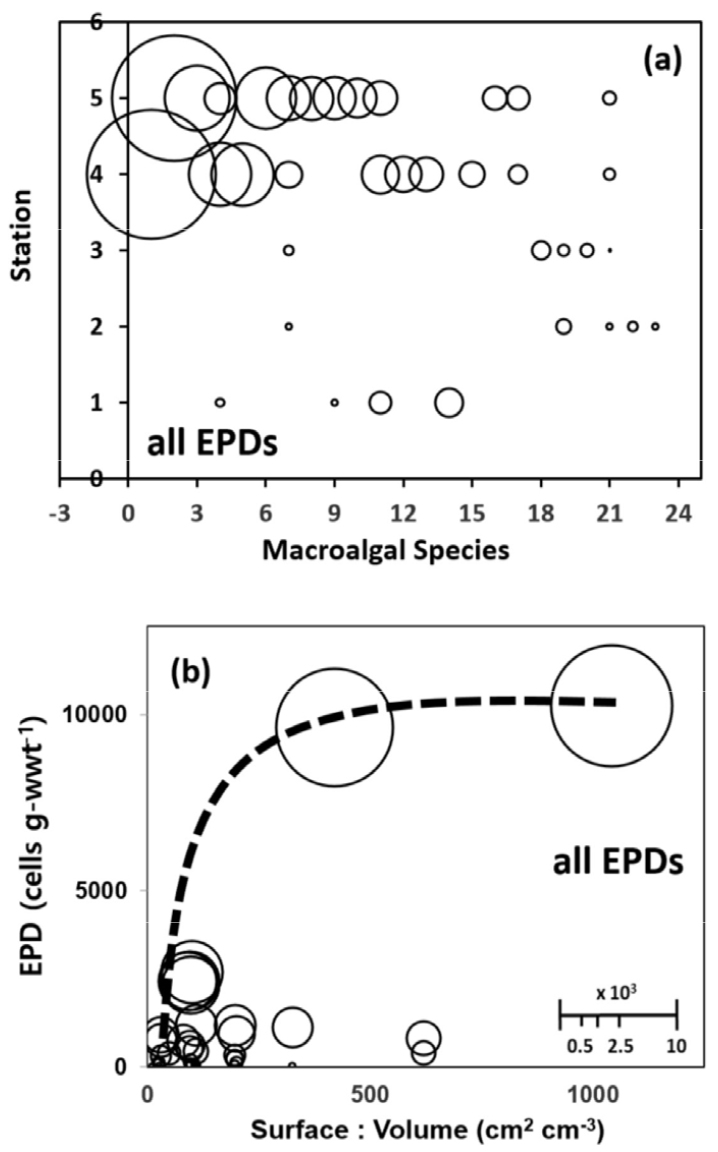
Fig. 3.
Balloon diagrams of the total sum of epiphytic dinoflagellate (EPD) abundance in each of the 45 macroalgal samples belonging to 24 species. (a) in the plane of substrate macroalgal species and station axis, (b) in the plane of surface-to-volume ratio (SA/V ratio) and EPD abundance axis. Relative balloon scale for EPD abundance (cells g-wwt-1). The numbers in the substrate macroalgal species axis and the station axis of (a) indicate the 24 macroalgal species in the order of EPDs richness and the five sampling stations (1: Hahnlim, 2: Kosahn, 3: Sahgye, 4: Namwon, 5: Seongsan, as is in Fig. 1), respectively. The dashed line in (b) indicates the pattern of increasing maximum EPD abundance at a SA/V ratio as the SA/V ratio of substrate macroalgae increases
Thus, the remaining 39 out of the 45 substrate samples hosted less than 30% of the total EPD abundance, which highlights the extremely heterogeneous distribution of EPD abundance among the various substrate species as well substrate samples (Fig. 3). Among macroalgal substrate samples even belonging to the same species this trend of heterogeneous EPD distribution was not uncommon (Table 2). All the 4 different common macroalgal species collected from 4 or 5 stations exhibited similarly extreme heterogeneity in intra-specific EPD distribution in terms of total EPD as well as genus-specific EPD abundances (Table 2).
Table 2.
Heterogeneous distribution of abundance of the epiphytic dinoflagellate (EPD) among substrate samples belonging to the same species (Amphi: Amphidinium spp, Coolia: Coolia spp, Gambi: Gambierdiscus spp, Ostreo: Ostreopsis spp, Proro: Prorocentrum spp.). Sum of total EPD abundances from St. 4 and St. 5 occupied 90.8% with the remaining 9.2% from the other 3 stations (Sts. 1, 2, and 3). SEM and SEM% denote standarderrorof the mean and the percentage ratio proportion of the intra-species (intra-sp.) SEM divided by the macroalgal species (MA sp.) mean, respectively
Average Number of EPD Genera in a Substrate Macroalgal Sample vs. EPD Abundance
Substrate averaged EPD abundance in each of the five stations (Fig. 1) exhibited huge variation when plotted on the plane of substrate-specific average number of EPD genera (x-axis) and percent frequency of EPD presence among all the substrate sample (y-axis) in a station (empty circles in Fig. 4). The substrate-specific average number of EPD genera was over 2.0 in Sts. 4 and 5 with richer EPD abundances in contrasts to the lower average numbers in Sts. 1 (0.75), 2 (0.75), and 3 (1.00) with very poor EPD abundances (Fig. 4). The three stations with lower average number of EPD genera were with very high portion of substrate samples without any EPD cells (28.6–50.0%) while the other two stations had no substrate samples without EPD (Fig. 4). Thus, the 5 sampling stations could be separated into two groups, one in the south-eastern side (Sts. 4 and 5) with rich EPD abundance and the other in the western end side of Jeju Island (Fig. 1) with very poor abundance and low genus diversity of EPDs (Sts. 1, 2, and 3). As the number of EPD genus in a macroalgal substrate sample (Fig. 5) moves from 1 to 5, the minimum (Fig. 5b) rather than average (Fig. 5a) EPD abundance increased exponentially. Therefore, among all the 36 macroalgal substrate samples with EPD cells, the ones with single EPD genus had the least EPD abundances in the present study (Fig. 5).
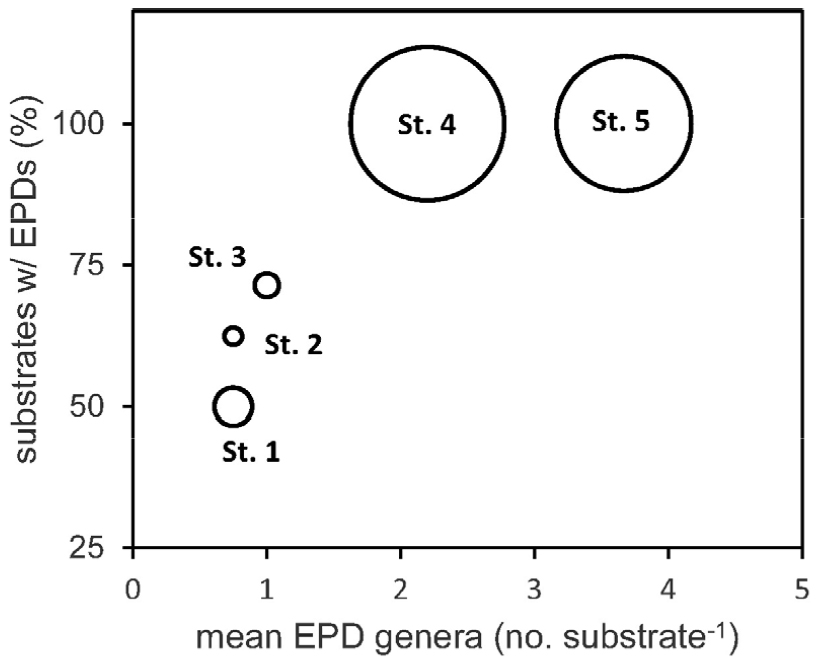
Fig. 4.
Average epiphytic dinoflagellate (EPD) abundance in the macroalgal substrate samples in the plane of average number of EPD genera in a substrate sample (horizontal-axis) and percentages of substrate sample with EPD cells on the macroalgal blades (vertical-axis). Sum of the average EPD abundances from St. 4 and St. 5 occupied 94.25% with the remaining 5.75% from the other 3 stations (Sts. 1, 2, and 3)
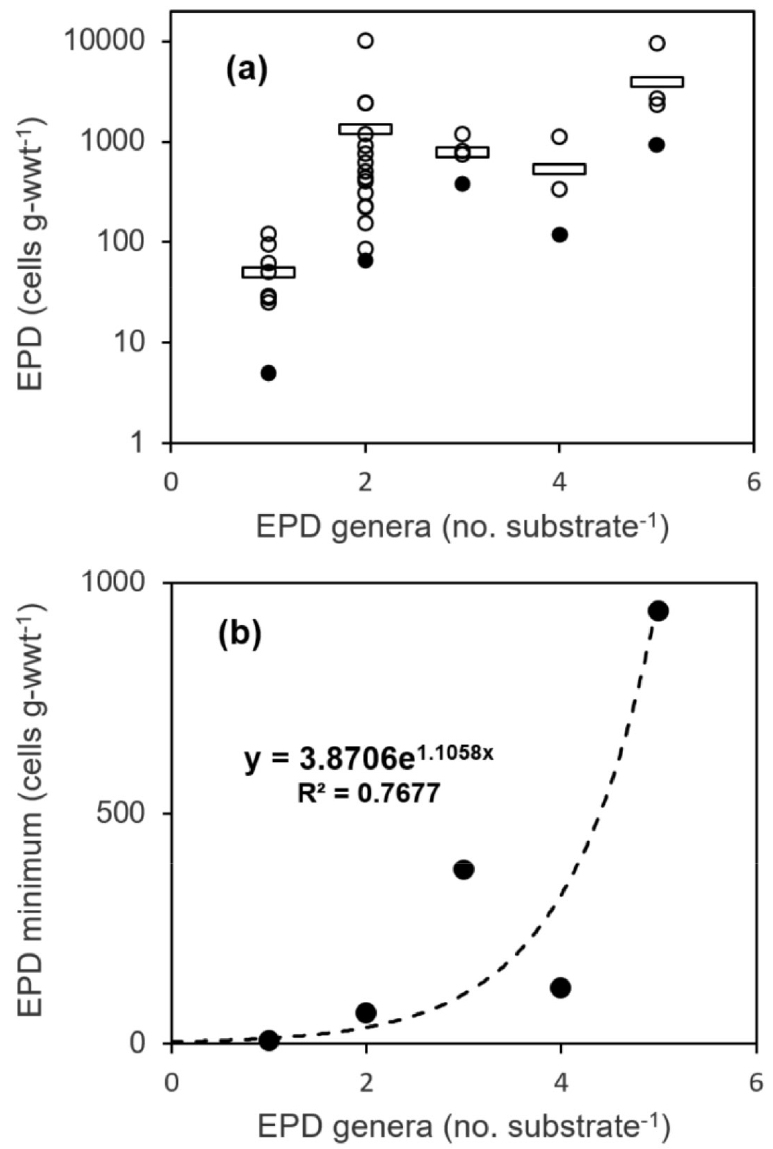
Fig. 5.
(a) Scatter diagram of macroalgal substrate samples on the plane of number of epiphytic dinoflagellate (EPD) genera (horizontal-axis) and EPD abundance (vertical-axis) in each substrate samples. Average and minimum EPD abundance in each number of EPD genera in a substrate sample is marked as a horizontal bar and a dark circle, respectively. (b) Minimum EPD abundances (dark circles) increased exponentially as the number of EPD genera in a macroalgal substrate sample increased
Distribution of Epiphytic Dinoflagellate Genera in Various Substrate Macroalgal Species
Of the 45 macroalgal samples, only 4 samples representing 4 different species (Chordaria flagelliformis, Martensia sp, Sargassum sp, and Padina arborescens) hosted all the 5 EPD genera in each sample. Similar to the case of heterogeneous distribution of total EPD abundances in the substrate species (Table 2), the abundance of each EPD genera in 24 species representing 45 substrate macroalgal species again revealed a highly variable distribution pattern as is shown in Fig. 6 for the two most dominant EPD genera, Ostreopsis and Gambierdiscus. Ostreopsis spp. and Gambierdiscus spp. occurred in 32 and 29 out of 45 macroalgal samples (Fig. 6) and with sample- averaged abundance of 640.4 and 600.1 cells g-wwt-1, respectively. The notable dominance occupied by only the two of the five EPD genera, Ostreopsis and Gambierdiscus, however, might simply reflect the seasonal (autumn) nature of the sampling stations off Jeju coast.
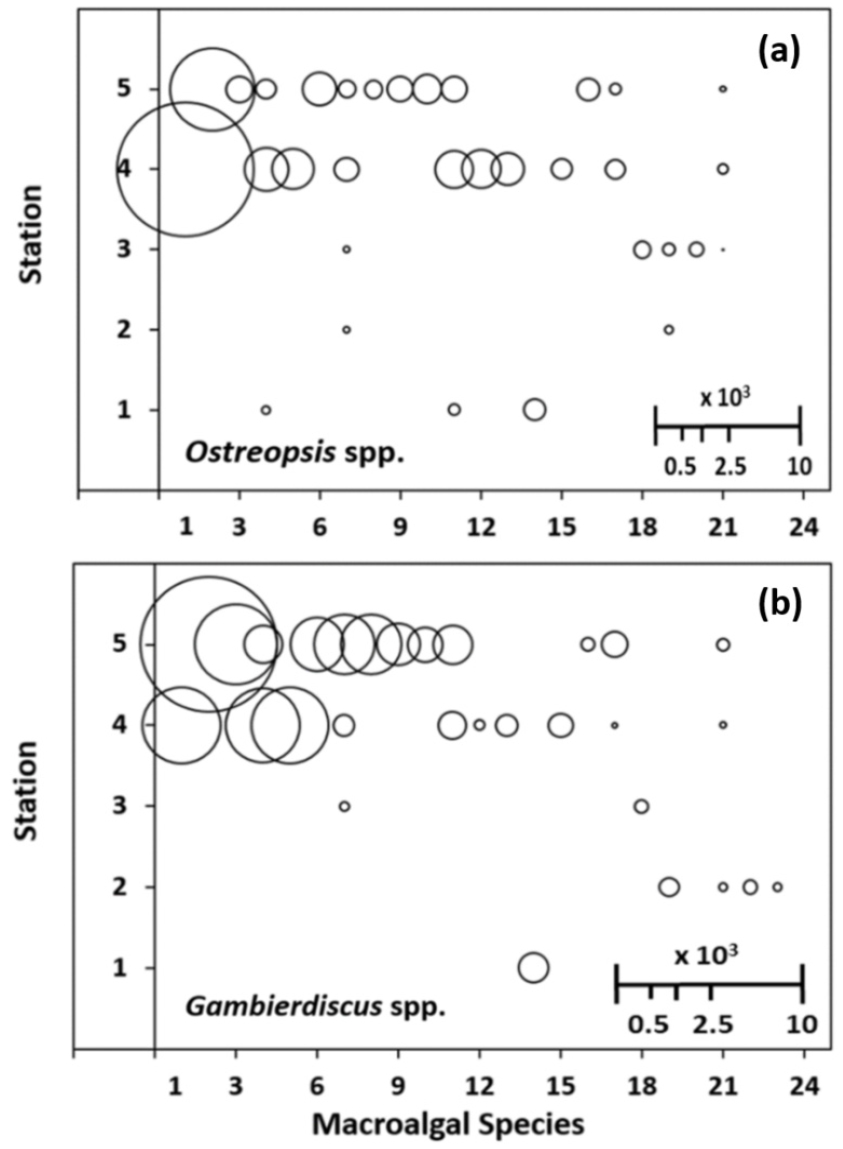
Fig. 6.
Balloon diagrams of the abundance of epiphytic dinoflagellates (EPDs) in the plane of macroalgal species and station axis. (a) Ostreopsis spp., (b) Gambierdiscus spp.. Relative balloon scale for EPD abundance (cells g-wwt-1). The numbers in the substrate macroalgal species axis and the station axis indicate the 24 macroalgal species in the order of EPDs richness and the five sampling stations (1: Hahnlim, 2: Kosahn, 3: Sahgye, 4: Namwon, 5: Seongsan, as is in Fig. 1), respectively
The first six substrate samples with the highest abundance of EPD genera (Fig. 6) represented six macroalgal species in the order of Derbesia sp., Martensia sp., Chordaria flagelliformis, Plocamium telfairiae, Pterocladiella capillacea, and Padina arborescens (macroalgal species 1–6 in Fig. 6). The first two species, Derbesia sp. (SA/V ratio of 1042) and Martensia sp. (SA/V ratio of 420) are among the morphological groups MG2 (filamentous or delicately branched form) and MG1 (thin tubular or sheet-like form), respectively (Table 1). Each of the above six substrate species hosted Ostreopsis spp. and Gambierdiscus spp. (Fig. 6), and three of the six species hosted all five EPD genera (data not shown here).
When plotted in the plane of SA/V ratio and EPD abundance axis (Fig. 7), the maximum abundance in each EPD genus generally increased as the SA/V ratio of the substrate species increased from 0 to ca. 500 cm2 cm-3 (arrows in Fig. 7b and c). However, as the substrate SA/V ratio increased up to 10,000, the maximum abundance of Ostreopsis spp. alone increased even further (Fig. 7a). The sticky mucus from the dense population of Ostreopsis spp. (Mohammad-Noor et al. 2005) may serve as an additional adhering surface to support their own expanded growth. Thus, Ostreopsis populations can inhabit the air-water interface of sea surface (Vila et al. 2016) as well as the thin filamentous morphological groups of substrate macroalgae (MG2 in Table 1), where the other 4 genera appear less successful than Ostreopsis population (Fig. 7b and c). Regardless of the SA/V ratio range and species differences among the substrate macroalgae, the maximum abundance of each EPD genus in autumn 2009 showed a notable genus-specific difference. For Ostreopsis, Gambierdiscus, Coolia, Amphidinium, and Prorocentrum, the maximum was 8660, 4870, 710, 410, and 300 cells g-wwt-1, respectively (Fig. 7) with an average of 640, 600, 310, 110, and 100 cells g-wwt-1, respectively. Thus, the most abundant genera were Ostreopsis and Gambierdiscus while Amphidinium, and Prorocentrum were the least abundant (Fig. 7).
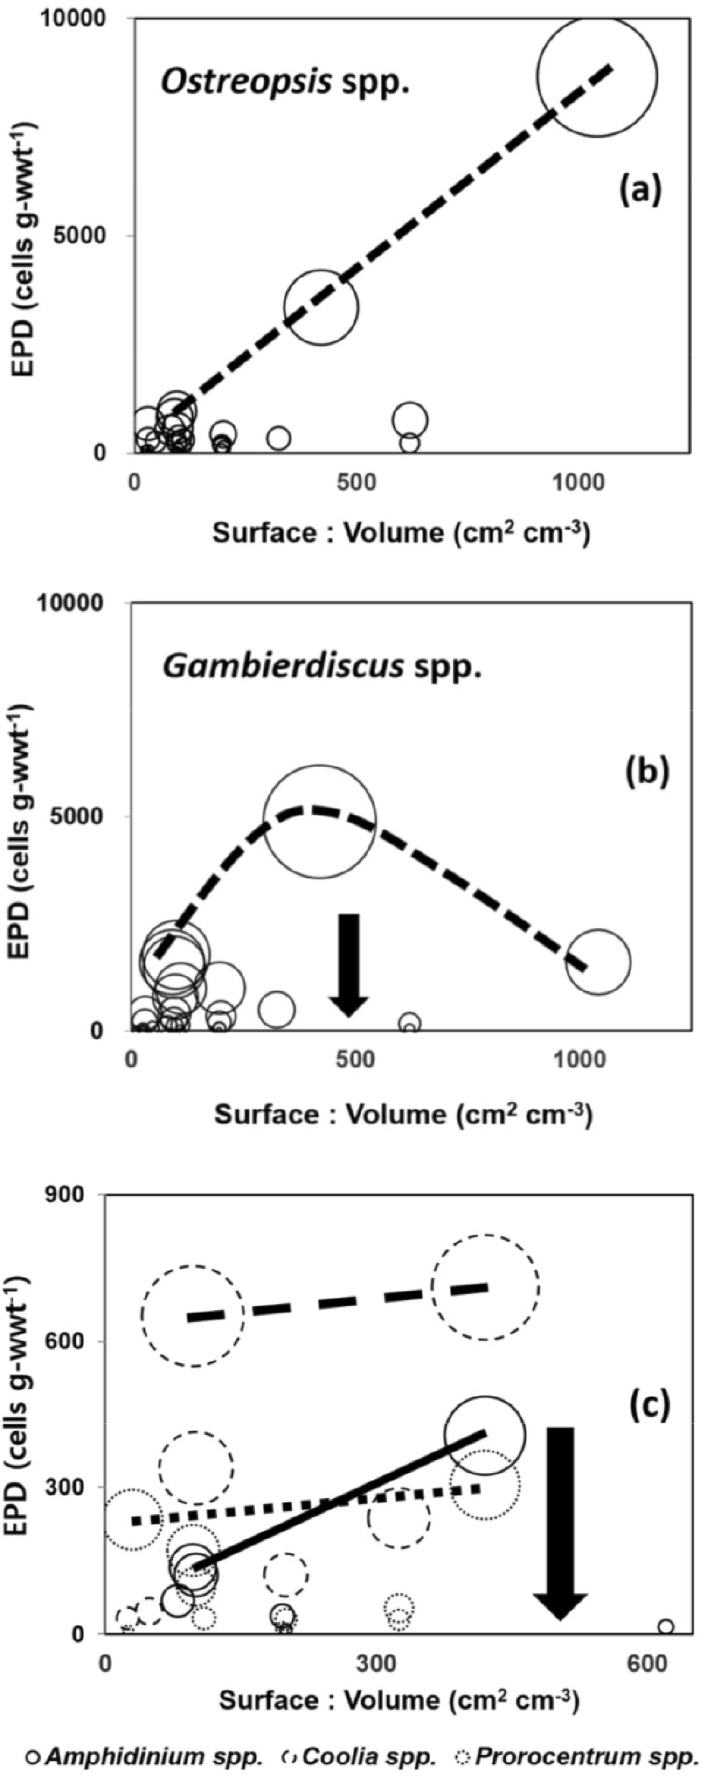
Fig. 7.
Balloon diagrams of the abundance of five epiphytic dinoflagellate (EPD) genera in each of the 45 macroalgal samples belonging to 24 species in the plane of surface-to-volume ratio (SA/V ratio) and EPD abundance axis. (a) Ostreopsis spp., (b) Gambierdiscus spp., (c) Amphidinium spp., Coolia spp., and Prorocentrum spp., which was represented by the solid, dashed, and dotted circles, respectively. The arrows in (b) and (c) indicates the SA/V ratio of 500. The solid, dashed, and dotted lines in (c) indicate the variation pattern of maximum EPD abundance at a SA/V ratio as the SA/V ratio of substrate macroalgae increases. Each relative balloon scale represents the EPD abundance corresponding to the vertical axis value (cells g-wwt-1)
This heterogeneity and variability in the spatial abundance distribution of total EPDs as well as EPD genera may in part reflect the multi-dimensional complexity of environmental conditions for the population success of the EPD species in Jeju coastal waters.
Epiphytic Dinoflagellate Abundances in Relation to the Morphology of Macroalgal Hosts
Of the 24 macroalgal species representing the 45 macroalgal substrate samples, 6 different morphological groups (Table 1) had distinct SA/V ratios as shown in Fig. 2. The morphological group with the highest SA/V ratio, MG2 (delicately branched) (Fig. 2), was found only in Chlorophyte samples, and MG5 (articulated calcareous) and MG6 (encrusting) only in Rhodophyte samples (Table 1). Morphological groups MG1 (thin tubular and sheet like) as well as MG3 (coarsely branched) with a very wide range of SA/V ratio (Fig. 2) were common in all the three macroalgal phyla including Phaeophyte (Table 1). In order to re-analyzing the EPD distribution pattern (Fig. 8), genus- specific EPD abundances at each MG-Station coordinate points were illustrated (Fig. 9).
The number of macroalgal species at each MG-Station coordinate point (Fig. 8a) distributed more or less evenly when compared to the average EPD abundance (Fig. 8b). The average EPD abundances was much higher in Sts. 4 and 5, where the macroalgal species belonging to MG1 and MG2 were with most abundant EPDs (Fig. 8b). The MG diversity was highest in St. 4 with 5 MGs, but the distribution of high EPD abundances in St. 5 was fairly even among the 4 MGs, in striking contrast to the quite heterogeneous one in St. 4 (Fig. 8b).
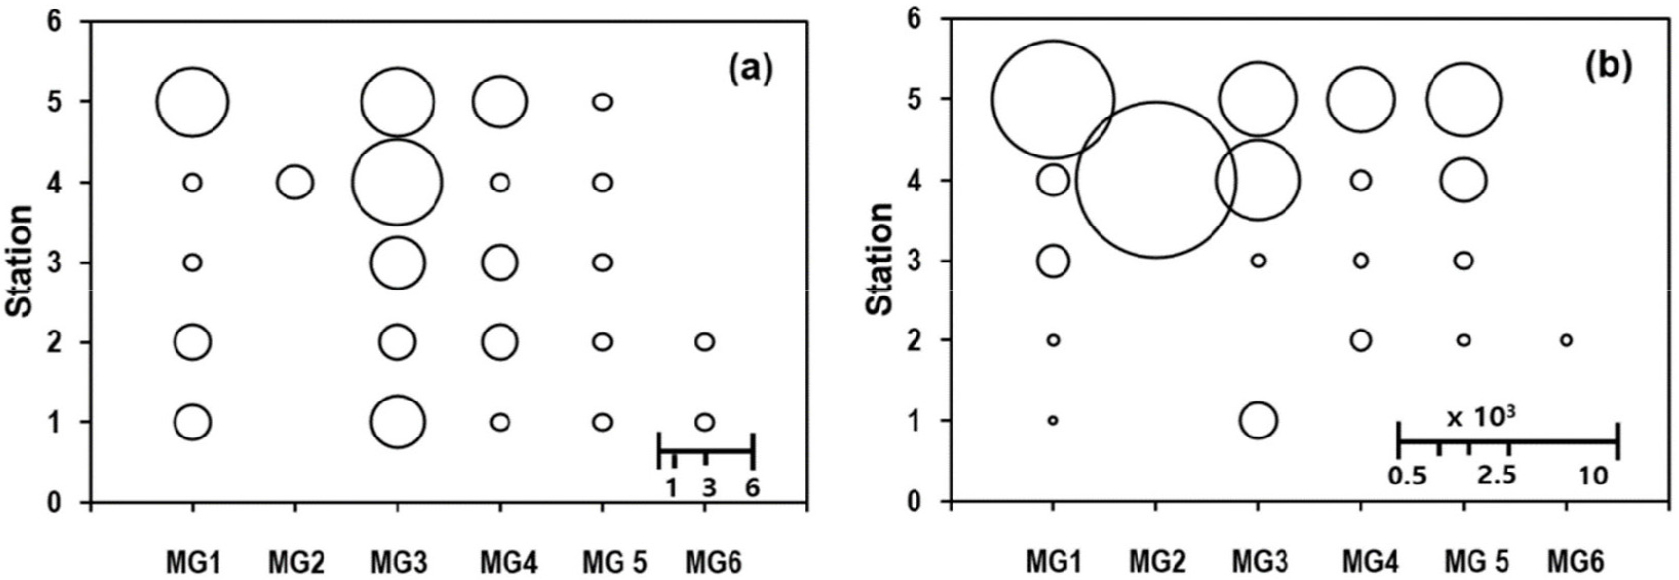
Fig. 8.
Number of macroalgal species (a) and average epiphytic dinoflagellate (EPD) abundance (cells g-wwt-1) (b) in each combination of Morph-group (MG, x-axis) and sampling station (y-axis). Stations 4 and 5 were with relatively higher substrate species number and richer EPD abundances. The other stations (1, 2, and 3) exhibited very low EPD abundances (b) even in combination points with 3 substrate species (a). Each of the 5 combinations points (stations) for MG5 were with equally one substrate species (a), in which the average EPD abundance was far greater in stations 4 and 5 than the other 3 stations
The distribution patterns of average EPD abundance (Fig. 8b) and total EPD abundance for each substrate sample (Fig. 9a) at the MG-Station coordinate points were generally very similar to each other. Abundance of Gambierdiscus spp. (Fig. 9d) and Ostreopsis spp. (Fig. 9e) covered much more MG-Station coordinate points than that of the other three EPD genera covering 3 (Coolia spp.), 4 (Amphidinium spp.) and 6 points (Prorocentrum spp.) (Fig. 9b, c, and f). The Station 5 (Seongsan, Fig. 1) was the highest in diversity of MG and EPD genus, and hosted the highest EPD abundances in most of the 5 MGs and the 5 EPD genera (Fig. 9). One of the exceptional points was the coordinate point of MG2-St. 4 where the maximum abundance of Ostreopsis spp. was located (Fig. 9e). Another exceptional point (MG3-St. 1) was represented by higher abundance of Prorocentrum spp. than that at St. 5 (i.e, at MG3-St. 5). In terms of EPD abundances, Sts. 4 and 5 were surprisingly rich in Gambierdiscus spp. (Fig. 9d) and Ostreopsis spp. (Fig. 9e). Regardless of MGs, Gambierdiscus spp. was generally more abundant in St. 5 than in St. 4 while Ostreopsis spp. showed more or less the opposite case. Among all the MG-Station coordinate points, the distribution of the 5 EPD genera exhibited far more distinct differences among stations than that among MGs. Relatively higher EPD abundances in MGs with higher SA/V ratio (MGs 1, 2, and 3) than in the remaining 3 MGs was evident in the two most abundant genera, Ostreopsis and Gambierdiscus (Fig. 9). The other 3 genera seemed to have occurred at the sampling stations with relatively too low abundances to be clearly resolved in respect to the gradient of MG as well as SA/V ratio or station.
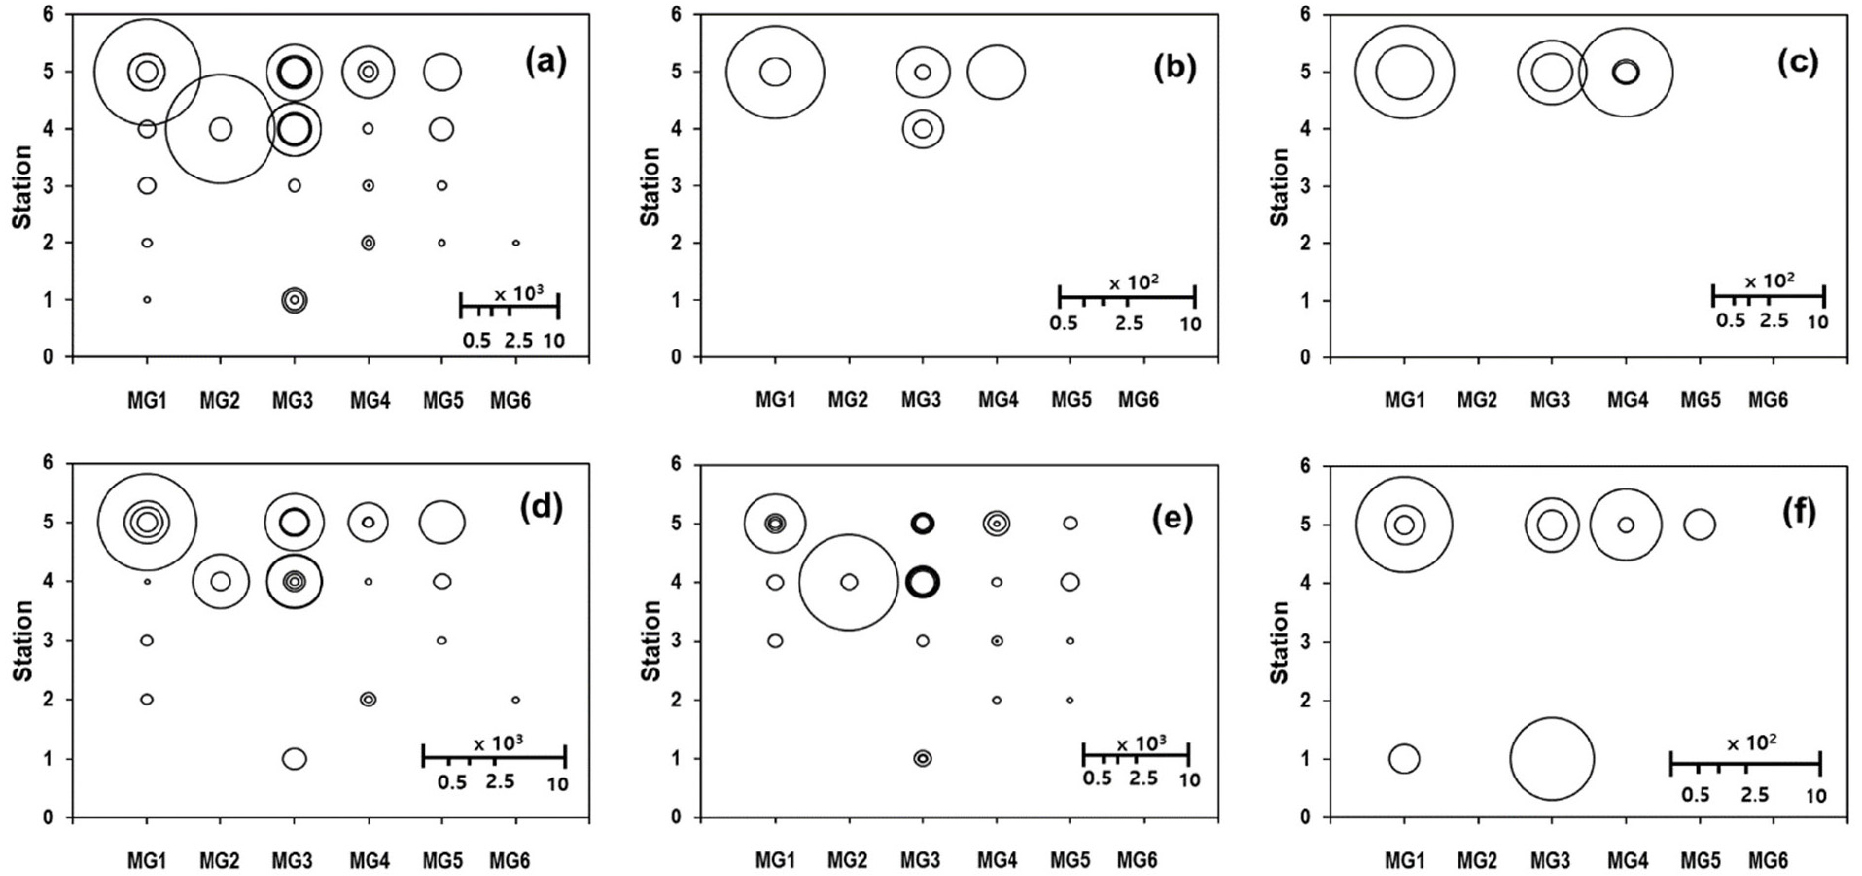
Fig. 9.
Epiphytic dinoflagellate (EPD) abundance on the each macroalgal substrate sample in the plane of Morpho-group (MG) of substrate macroalgal species (horizontal-axis) and sampling station (vertical-axis). (a) Total sum of the 5 EPD genera, (b) Amphidinium spp., (c) Coolia spp., (d) Gambierdiscus spp., (e) Ostreopsis spp., (f) Prorocentrum spp. (abundance unit: EPD cells g-wwt-1)
Ostreopsis and Gambierdiscus Abundances in Relation to Habitat Temperature and Salinity
Of the total EPD abundance from all the five stations, 90.6% were the two most common and abundant genera, Gambierdiscus and Ostreopsis, each accounting for 41.6% and 49.0%, respectively (Table 3). The two richest places accounting for 95.9% of the total EPD, St. 4 and St. 5, had Ostreopsis spp. accounting for 31.8% and 15.2% and Gambierdiscus spp.accounting for 13.0% and 27.3% of the total EPD, respectively (Table 3). The notably low EPD abundances in the other 3 stations at the western Jeju (Fig. 1) might be resulted from the local upwelling in the western tip of Jeju Island (Kim and Lee 1982; Ko et al. 2021). In fact the abundance of EPDs in the western tip of Jeju Island was also the lowest among all the 6 stations visited by Jang (2013) during the whole year.
Table 3.
Genus-specific average epiphytic dinoflagellate (EPD) abundances in all the samples (all Sts.) and in samples from Station 4 (St. 4) and Station 5 (St. 5). Stations 4 and 5 occupied 44.9% and 51.0% of the total sum EPD abundance from all the 5 stations, respectively. The sum of Gambierdiscus spp. and Ostreopsis spp. from Stations 4 and 5 represented 87.2% of the total sum EPD abundance from the 5 stations
Regarding water temperature (T) and salinity (S), the high abundance cores for Ostreopsis and Gambierdiscus populations were at Sts. 4 (St. Namwon with 22.1°C and salinity 29.2) and 5 (St. Seongsan with 21.0°C and salinity 32.5 (Fig. 10). Of the 2 stations, Ostreopsis spp. were more abundant at St. 4 with higher water temperature (Fig. 10a) while Gambierdiscus spp. at St. 5 with higher salinity (Fig. 10b).
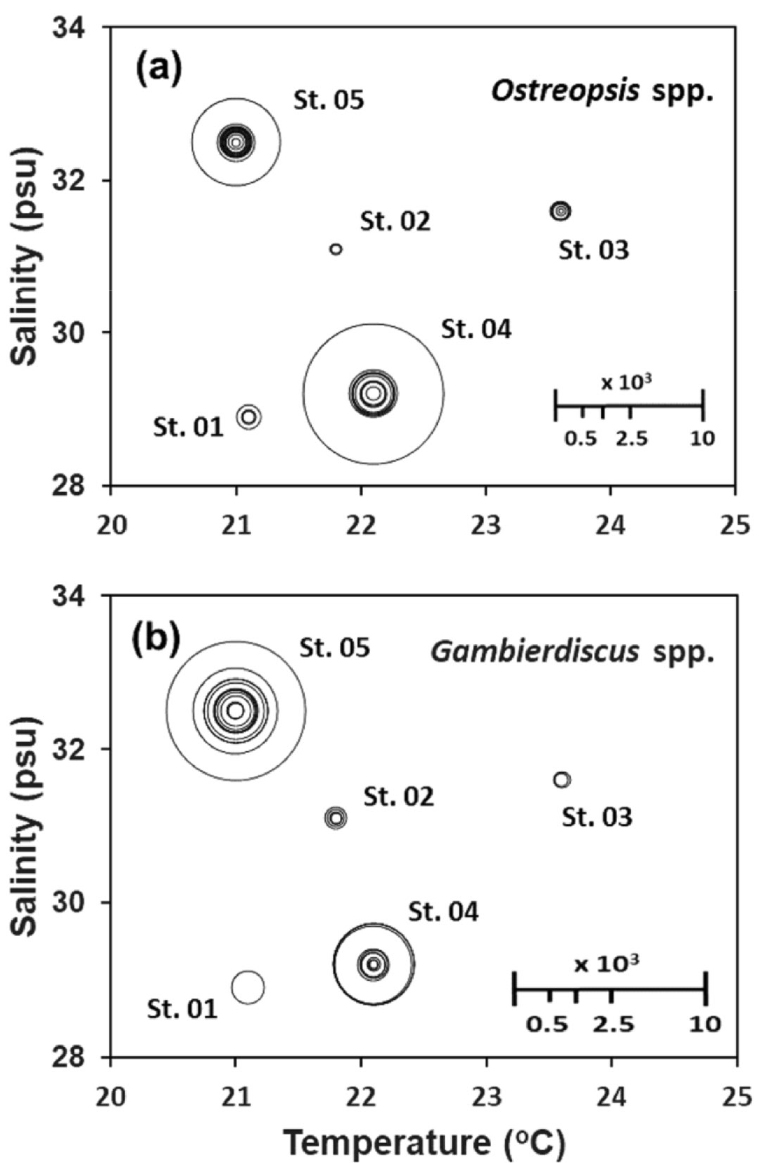
Fig. 10.
Balloon diagrams of the abundance of the two dominant epiphytic dinoflagellate (EPD) genera in each of the 45 macroalgal samples belonging to 24 species from the five stations around Jeju coasts. (a) Ostreopsis spp., (b) Gambierdiscus spp.. Relative balloon scale for EPD abundance (cells g-wwt-1)
The T-S condition for the two dominant populations in Fig. 10 may not mean anything without further comparative discussion, mainly due to the temporal limitation in samplings. At least seasonal investigation for multiple years would be required to understand the T-S relations with dominant EPD populations in Jeju coasts.
The salinity tolerance range of temperate Ostreopsis is known to be much wider than that of Gambierdiscus (Tanimoto et al. 2013; Castaño 2014; Sparrow 2017; Sparrow et al. 2017). Substantial seasonal variation in the abundance of Ostreopsis cf. ovata in North West Mediterranean Sea was correlated to seawater temperature with an optimum range from 23°C to 27.5°C (Cohu et al. 2013), where the Ostreopsis abundances got larger at higher temperatures.
The strong positive relationship between maximum growth rate and SA/V ratio of macroalgal species (Table 1 in Nielsen and Sand-Jensen 1990) might reflect the ecological benefit of the macroalgal species with larger SA/V ratio in their competitive growth. And then, the ecologically optimal T-S niche of Gambierdiscus and Ostreopsis populations may determine the relative growth success in a habitat with spatiotemporally variable T-S conditions. Jang (2013) conducted bimonthly EPD monitoring at six stations off Jeju coast from February to December 2011, and derived the T-S condition for the maximum Ostreopsis abundance (20.3°C and salinity 32.0) (see Fig. 24-D in Jang 2013, unpublished data). During the seasonal monitoring period from July 2016 to January 2019, Park et al. (2020) performed quantitative estimation of Ostreopsis abundance at four stations off Jeju coast. The T-S at abundance core of Ostreopsis spp. (24.5°C and salinity 32.5) was determined based on Fig. 8 in Park et al. (2020). The determined T-S condition fits well to Park’s report that Ostreopsis cf. ovata was abundant when the water temperature was 22–25°C and salinity was 31–34 (Park et al. 2020). Here, it can be tentatively proposed that the ecological niche of seawater temperature for Ostreopsis proliferation in the Jeju coast has moved from 20.3°C in 2011 (Jang 2013) to 24.5°C in 2016–2019 (Park et al. 2020).
4. Conclusion
EPD species distribution pattern around the Jeju coasts in 2009 (Kim et al. 2011) was characterized by spatial heterogeneity among stations (Figs. 3a and 6, Table 3) and variability among host substrate samples (Fig. 6 and Table 2), which may reflect the multi-dimensional and complex factors for optimal habitats that support population success of the EPD species. In a substrate macroalgal species with a specific SA/V ratio, the maximum abundance of Ostreopsis spp. increased proportionally as the substrate SA/V ratio increased up to 10,000 (Fig. 7a) whereas the proportional increases of the remaining 4 genera were kept until the SA/V ratio reach ca. 500 cm2 cm-3 (arrows in Fig. 7b and c).
Between the two most common and abundant genera, Ostreopsis and Gambierdiscus (Table 3 and Fig. 9), Ostreopsis spp. were most successful at St. Namwon with a seawater T-S of 22.1°C and 29.2 psu, followed by Gambierdiscus spp. at St. Seongsan with a T-S of 21.0°C and 32.5 psu (Fig. 10). From the previous works by Jang (2013) and Park et al. (2020), the optimum temperature for Ostreopsis proliferation in the Jeju coast was estimated to have shifted from 20.3°C (Jang 2013) to 24.5°C (Park et al. 2020) within 10 years.
In conclusion, when marine environment transitions to elevated seawater temperature or to favorable condition to host macroalgal species with high SA/V ratios (e.g, MF2 and MF1 in Fig. 2), proliferation of Ostreopsis populations might occur initially, leading to the success of other EPD genera in the coastal waters of Jeju Island.
Surface-to-volume ratio of the macroalgal substrates (SA/V ratio) as well as other environmental factors including water temperature and salinity might be primarily affecting the distribution pattern of EPDs in Jeju coastal waters. Therefore, the scientific monitoring on the multi-decadal shift of T-S conditions and the associated change of macroalgal flora in Jeju coastal waters is definitely needed to be prepared for the potential EPD disasters such as the ones in Mediterranean seas in these years (Sardo et al. 2021; Medina-Pérez et al. 2021; Tester et al. 2020; Wells et al. 2020).
