1. Introduction
The environment
What is known about icefish ageing
Icefish growth and sizes
Otolith shapes and sizes
Otolith mass
Errors and unreliable otolith readings
Lack of a credible ageing technique
Icefish growth and reproduction.
Lack of information about icefish ages and distributions
What needs to be done
CCAMLR conclusions and recommendations
2. Material and Methods
3. Results
Icefish age estimation
Icefish sexual differences
Co-occurring effects of fisheries exploitation and habitat conditions
4. Discussion
Age estimations
Life histories and distribution
Cold and warm years
Fishery and ecology
Dioxins and plastics
1. Introduction
This paper represents a Review, dealing primarily with the three species of icefish Chaenocephalus aceratus (Lönnberg, 1906), Champsocephalus gunnari (Lönnberg, 1905), and Pseudochaenichthys georgianus (Norman, 1937). The review is based on years of research by scientists from numerous countries and our own studies during several expeditions to Antarctica. We are providing a brief overview of the environment that the three species share and what has been known in relation to the biologies and interactions between the three species. Owing to our own areas of expertise, we then focus on four main aspects: 1.) Difficulties of age and growth determinations of Channichthyidae; 2.) Age determination methods for Channichthyidae and our own approach; 3.) The role of the otolith’s shape and structure in determining a fish’s life strategy and 4.) Predicting the likely future of the three icefish populations in the face of overfishing, global warming and pollution.
The environment
This review focuses on otoliths and their significance in determining the ages of icefishes. The latter, also known as white-blooded fish, occurs in the oceans around Antarctica and all 16 currently recognized species are assigned to the family Channichthyidae. The need to protect and understand the southern ocean’s ecosystem has been emphasized by Brooks et al. (2022) and a very brief description of the Antarctic marine environment and its history of the last 38 million years has been given by North (1991). Data on the ecological features and adaptations of Antarctic fishes generally are provided by, amongst several others, Di Prisco et al. (1991), Clarke and Johnston (1996), Vacchi et al. (1999) and most recently Eskuche- Keith et al. (2025). The three species we chose for this study (with their respective FAO identification codes of SGI, SSI, and ANI) were Pseudochaenichthys georgianus (henceforth in this paper referred to as Ps. georgianus to avoid confusion with the genus Pagetopsis), Chaenocephalus aceratus (henceforth referred to as Chaen. aceratus) and Champsocephalus gunnari (in the following referred to as Champ. gunnari, to avoid confusion with the genus Channichthys). Like all species of the Channichthyidae, these fishes are famous for their lack of haemoglobin in their blood and myoglobin in their skeletal muscles. This puts limitations on the activity of their muscles and determines locomotion involving mainly the pectoral fins as an energy saving swimming strategy (Twelves 1972; Walesby et al. 1982). Since only small amounts of myoglobin remain in their skeletal and heart muscles (Douglas et al. 1985; Jakubowski 1971). The fish rely on oxygen from passive transport in their colorless blood via diffusion from the cold surrounding water through their body and fin surfaces (Sidell and O’Brien 2006), and especially the large head part that measures up to 44% of SL (Fisher and Hureau 1985; Traczyk and Meyer-Rochow 2022).
All icefish species possess scaleless bodies, which reduces their body’s resistance and saves the fish energy during swimming, for which the fish use their pectoral fins instead of body undulations (Altringham 1999; Davison and MacDonald 1985; Harrison et al. 1987). Fish scales do not generally limit the penetration of oxygen through the skin of a fish (Jakubowski 1971), but their absence in icefish probably permits an increased rate of oxygen exchange across the skin’s surface (Traczyk 2023). Moreover, it can facilitate the uptake of oxygen dissolved in the frigid water in addition to that occurring in the gills of the fish (Rankin and Tuurala 1998). Icefish have relatively large hearts (Johnston et al. 1983), a larger blood volume and denser capillaries and sinuses than most fish (Walesby et al. 1982). Ps. georgianus are migratory (Mucha 1980), congregating in eddies (Sosiński and Paciorkowski 1993) where krill which is their principal food (Kock et al. 1991) becomes concentrated (Sahrhage 1988). Lunging forward and attacking their prey is not necessary when eddies gather krill, and all an icefish has to do is to scoop up as much of it in their mouths as they can hold, since a krill cluster is not a school of escaping fish. When krill rise or move to deeper water, they swim very slowly sideways (Sahrhage 1988).
Based on observations over many days and analyses of Ps. georgianus swimming in the aquarium (Rec. 1), it follows that this species does not and cannot dart forward, because its pectoral fins have to fit tightly to the side of the body to reduce water resistance, which is impossible, because these fins are very large (Fisher and Hureau 1985) and because of an absence of a buoyant swimbladder to provide the fish with lift through their constant vertical wavy up-and-down movements, vid. Rec. 1. This suggests that conclusions such as prey not being seized if it does not move (Fanta and Meyer 1998) are wrong and that prey detection depends on sensitive vibration receptors (Montgomery and Macdonald 1987) and vision (Miyazaki et al. 2011). Comparing gape sizes, Eskuche-Keith et al. (2025) concluded that gape sizes were smaller in fish that fed on benthic prey than individuals that were feeding almost exclusively on krill like Ps. georgianus or mainly on fish like Chaen. aceratus. The ecological niche a species occupies and the role it plays in it are reflected by its morphology. Of all the species feeding on krill pectoral fin areas were largest in Ps. georgianus (Eskuche-Keith et al. 2025).
What is known about icefish ageing
The present exploitation of icefish, a valuable component of Antarctica’s Living Resources, has been planned and administered as a sustainable fishery that has to take into account the stock of fish present (Kock and Köster 1989; La Mesa 2004). The latter needs to be based on estimations of all age groups and inter-species interactions, for which a variety of methods have been described (Vitale et al. 2019). Different age groups, however, are known to occur at different preferential depths, may undergo vertical or horizontal migrations, have different food preferences and exhibit maximum body sizes and longevities that depend on environmental factors such as food availability, pressures from predators and stresses related to climate change and anthropogenic pollution. It follows that in order to understand how fish populations react to fishing and the environmental pressures, the knowledge of a population’s age structure is crucial (Zheng et al. 2025).
The international administration’s aim, according to the Commission for the Conservation of Antarctic Marine Living Resources (CCAMLR), is to stop harvesting these fishes without restrictions as that can lead to their total or nearly complete exhaustion (Traczyk 2023). Fishing in the past focused on large icefish specimens, (Sosiński and Paciorkowski 1993), congregated in one region of known spawning areas and did not provide sufficient means for allowing age and growth estimates, for which icefish otoliths of all age groups would have been necessary (Jakubowski 1971; Everson 1981). Not only is this difficult to achieve but published data available exhibit wide differences and have led to conflicting estimations (Mucha 1980; Everson 1981; Coggan and White 1986; Kock 1989a; Żabrowski 2000).
Icefishes are too weak and vulnerable for current tagging methods to be used successfully; they do not possess scales and exhibit reductions of bones and bone material so that complete years of life are not reflected in their growth. A reliable estimation of icefish ages can therefore only be obtained from increments of otoliths and fish sizes as explained by Traczyk and Meyer-Rochow (2019), which would then, together with life history data, allow the formulation of an age-structured matrix model (Fujiwara 2025). Otoliths consist primarily of calciumcarbonate (CaCO3) in the form of aragonite in the sagittae and lapilli, but vaterite in the lagena otoliths, known as asterici (Schulz-Mirbach et al. 2019). Although the lagena (Meyer-Rochow et al. 1992) and other than calcium elements (Fraile et al. 2016) can also be important in conclusions about a fish’s postembryonic developmental history, for fish age investigations the sagittae are preferred; they were also the otoliths that our investigations and conclusions are based on.
Icefish growth and sizes
When food is plentiful, larval, postlarval and young icefish can increase in size relatively quickly (Jakubowski 1971). Although interest in icefish larvae and their development and growth initially led to a number of papers (e.g., Efremenko (1979) examined a variety of Channichtyidae larvae, Ślósarczyk (1987) reviewed early life histories of Channichthyidae generally, Gon (1990) studied postlarvae of Cygnodraco mawsoni, Kellermann (1989) and Kellermann et al. (2002) focused on early larvae of Chionodraco rastrospinosus and Ps. georgianus, respectively, and North (1991; 1998) examined the feeding ecology of Champ. gunnari), reliable data on larval sizes in relation to their ages even now are still not available for most Nototheniidae let alone Channichthyidae.
Separate age groups show frequencies of total lengths or some other parameters such as body mass, especially when combined. Each species of icefish has a single spawning and hatching period per year (Kock and Everson 1997), one species following another from winter to spring (North, 1990). Because of their fast growth rates of 6–10 cm per year (Jakubowski 1971), this substantially separates the new annual generations, i.e., age groups in total length frequency from catches in December, January and February. The total lengths of the older fish do not yield direct information about their ages, because their somatic growth ceases in favor of generative growth (Skeeles and Clark 2023). However, indirect age information is obtainable (Sparre and Venema 1998) when length data are combined with: a) descriptive parameter(s), such as body mass or b) with weak and strong generations (Traczyk and Meyer- Rochow 2019). This has to be done in accordance with the ELEFAN (Electronic Length Frequency Analysis) and Bhattacharya methods (Hampton and Majkowski 1987) by mapping the percentage of share of different generations in mixed length classes.
According to Traczyk and Meyer-Rochow (2019, 2022) and Traczyk et al. (2020, 2021) adult age groups differ on the basis of their numbers of individuals between different generations, e.g., strong and weak as well as high and low numbers of hatched larvae, maintained by oscillations of cold years (optimal for Ps. georgianus) and warm years (optimal for Chaen. aceratus and Champ. gunnari). To possess accurate information on the length of the fish at each age is a crucial and necessary requirement in order to obtain the distribution, appearance and biomass characteristics of the fish (Support.echoview.com). It is because age readings, exactly matching every individual, are too time-consuming to carry out on hundreds if not thousands of individuals, they cannot be applied routinely to large numbers of fish. Key length-ages were used by Sparre and Venema (1998) to separate the total number of fish into age-groups according to their proportion in each length class of age readings, taking into account depth zone and statistical area.
Otolith shapes and sizes
It is known that increments related to a fish’s age leave internal and external morphological marks on the otoliths (Traczyk et al. 2021). It has also been noticed that differences of otoliths at different developmental stages and geographic locations can be regarded as independent issues. However, taking into account the structure and variety of functions of the otoliths in the lifetime of a fish, the issues are interrelated and this has been pointed out in the holistic approach by Schulz-Mirbach et al. (2019). She showed that developmental and genetic mechanisms, phylogenetic constraints, ecological factors and environmentally induced phenotypic plasticity all play some role in how an otolith is built and functions. The marks on the otoliths are not easy to recognize, because icefish generally live in deeper water below 200 m, where there is no clear thermal seasonality that could lead to wider summer and narrower winter increments (Everson 1981; Mucha 1980; Kock 1989a; North 1990; Traczyk 2023). Moreover, 4 signs (autumn–winter–spring–summer), completing the annual growth, were found in the otoliths to be easily confused with 2 (summer–winter) signs (North 1990; Traczyk 2023). Similarly, pelagic fish species like Champ. gunnari make two daily migrations, one at night at 21.00 and one at dawn, around 03.00 (when fish concentrate before dispersing (North 1990). Thus, not only one migration (crossing the sound channel) leaves a mark every 24 hours in the otoliths and this may further generate the possibility of misinterpreting the number of daily increments. As microincrement collagen scaffolds constitute not cubic but intertwining rhomboids (Wróblewski 1983; Traczyk and Meyer-Rochow 2022), not one but two neighbouring daily increments need to be considered (one already aragonized, with its diagonal extensions at the otolith’s surface, initiating a second daily elastic layer of collagens to be further aragonized). Additionally, the unique biology of icefish such as breathing through their skin, doubles their sensitivity to impurities, modifies the processes of self-organization and alters the pattern of increments in the otoliths of icefish (Traczyk and Meyer-Rochow 2022), sometimes rendering them unreliable in older fish.
The external otolith morphology (otolith length OL or height OH, radius, thickness, perimeter, etc.: Hecht 1987), is commonly used for age and growth estimation (Radtke 1990; Reid 1996). However, growth of OH in icefish is irregular during ontogeny, may stop, or is insignificant after maturity (Hecht 1987; Traczyk et al. 2021). Otolith Length of young and immature Champ. gunnari is smaller than OH (Hecht 1987; Volpedo et al. 2008) and because of that increments along the OL become squeezed by comparison to OH. It then cannot be referred to as normal widths of increments especially as counted and measured partially on the median curved surface of the otolith (Radtke 1990). An OH larger than the OL is indicative of the fish’s vertical migration (Traczyk and Meyer-Rochow 2022) and supported by daily increments in the otolith. However, during growth, the otoliths’ collicula overgrow their otoliths’ margins, making the otoliths’ lengths with the colliculum bigger than the otoliths’ heights (Hecht 1987; Reid 1996). An increasing colliculum indicates a change in balance (change of the body's centre of gravity by creating a large reproductive mass, characteristic of the mature stage) and swimming conditions, supporting horizontal migration to inshore spawning areas (Traczyk et al. 2021; Traczyk and Meyer-Rochow 2022). The large changes affecting otolith morphology have species specific basic functions by determining the optimal way of swimming and maintaining balance under changing environmental conditions (Traczyk and Meyer-Rochow 2022). This has often not fully been recognized (Volpedo et al. 2008) and has led to misunderstanding the functional significance of the otoliths’ shapes.
Otolith mass
Otolith mass (OM) is the second most commonly used descriptive parameter to determine an icefish’s age. However, the otoliths of Champ. gunnari are very small and light, which makes them difficult to measure with sufficiently high accuracy to display true separate age groups in the frequency distribution of the otolith mass data. However, OM is constantly increasing during the course of ontogenesis as opposed to OL or OH and therefore we had earlier suggested (Traczyk et al. 2021) that the best way to determine age is to focus on prominent frequency peaks and the number of increments in relation to OM.
Errors and unreliable otolith readings
Otolith studies can help to gauge the amount of environmental pollution by analysing otoliths with irregular shapes and components. Such changes may stem from global warming, fishery activities and/or contamination. Lack of otolith edges (indicating the effects of pollutants) are now so common that they are almost considered as normal. The changes concern all aspects of all age groups, and even if only slight, they alter the average values of their distributions in each new season and for this reason we propose a method of estimating relative age groups on the basis of the frequency of otolith mass. During otolith calcification a replacement of heavy aragonite by lighter vaterite influenced by contaminants takes pace, which results in abnormal otolith shapes. The latter affect the fish’s behaviour and may cause them not to reach or recognize their spawning grounds, thereby foregoing spawning (Campana 1999).
Lack of a credible ageing technique
Although a variety of fish age estimation techniques exist (Vitale et al. 2019) and it is generally accepted that for an effective management of a fish population its age structure needs to be known, not all methods are applicable to Antarctic species (Zhu et al. 2020). Age influences growth rate, mortality, age at first maturity as well as fish’s vertical and geographic spatial distribution. Therefore, a multimodal method that combines all available data sources has been suggested to improve the efficiency of age estimation and to prevent errors (Zheng et al. 2025). Each datum, i.e. microstructure (daily increment) of otoliths, XYZ spatial morphology of otoliths, biological (distributions of fish length and otolith mass) and geospatial metadata (vertical and horizontal distribution near and far and east and west from shore) contains unique features characterizing age groups. When combined, these features provide a broader range of information about age and age group than a single feature analyzed separately.
In this study for accurate age determination, as in our work before (Traczyk and Meyer-Rochow 2019) we explore an alternative approach, utilizing microstructure: 1) daily growth rates of otoliths; 2) spatial morphology of whole fish otoliths; and 3) metadata related to biological data (fish length distributions and otolith masses) and 4) geospatial data (vertical and geographic variation in age group distributions). Combining several different data sets, such as microstructure of daily growth rates, XYZ spatial morphology of otoliths, and related metadata (length distributions, different vertical and spatial distributions of age groups, and temporal changes in recruitment due to stress) our approach significantly improves fish age estimation.
Currently, an approach that utilizes deep learning artificial intelligence techniques, which integrate various input data (image, text, numbers) and associated metadata has been propagated (Zheng et al. 2025). These authors have shown that even a simple combination of three different data sets leads to significant improvements in age classification accuracy. The process of learning to combine data with metadata improves the performance of the artificial intelligence model. For humans, this would be equivalent to repeatedly reading text to enhance its perception, or, e.g. repeatedly reading increments to verify and increasing accuracy (Zheng et al 2025).
Published age data obtained from Southern Ocean species by various methods of estimation exist (Liu et al. 2022; Li et al. 2025), but in connection with icefish species in some cases with differences of up to 5–10 years for the same species of fish (cf., Traczyk and Meyer-Rochow 2019). Ages obtained on the basis of length frequency compositions in Champ. gunnari have errors for first mode 16 cm newly recruited fish, covering the range of 4–18 cm TL individuals. Treating them as age group I, (Sosiński and Szlakowski 1992), does not agree with an icefish’s growth rate of 8 cm・y-1 (Jakubowski 1971). Based on this rate, the 1 cm TL icefish, newly during July to September hatched (0.1 y) individuals (North 1990), after 6 months in December would be of an average size of 4.5 cm TL and being 0.5 y of age. That is the first prominent peak in TL of 0 age group more numerous of Champ. gunnari larvae 3.0–5.0 cm in December (Kock and Everson 1997), and second separate at 18 cm. The separate 0 y age group confirms the daily increments in otoliths of 1.2–2.2 cm SL larvae equal to 8–42 days (0.1 y) and the discovery of larval growth rate of no more 11.4 cm・y-1 at Sth. Shetland (La Mesa et al. 2013); 8.4–13.5 cm・y-1 at Sth. Georgia Island (Kock 1980; Ślósarczyk 1987; Pakhomov and Pankratov 1994), and 9.2–15.8 cm・y-1 at Kerguelen (Duhamel 1995). It means that in December/January the length groups of about 4 cm SL and 18 cm SL should be treated as two separate age groups and not one.
There are errors also in connection with the three length groups of 16, 23 and 32 cm in Champ. gunnari, regarded by (Radtke 1990) as age groups of 3 years (1100 days), 5.5 y (2000 d), and 10.3 y (3800 d), separated by 2.5–4.8 years of body growth equal to 3.5–4.5 cm・y-1. This disagrees with the recognition as age groups of 1, 2, and 3 years, separated by one year of body growth equal to 7–9 cm・y-1 (Jakubowski 1971; Sosiński and Szlakowski 1992; Kock and Everson 1997; Traczyk and Meyer- Rochow 2019). Furthermore, this contradicts that Champ. gunnari of 38–55 cm TL, estimated to be of an age of 11.7–19 years (4300–7000 d) by Radtke (1990) represent age groups 4, i.e. 14 years of age (Sosiński and Szlakowski 1992; Kock and Everson 1997) resulting in a 5 year difference. Errors such as these can then enter estimates related to icefish growth, biomass assessment and catch limits and lead to misinterpretations or non-recognition of detrimental consequences in the icy ecosystem (Sosiński and Paciorkowski 1993; Mucha 1980; Sosiński and Szlakowski 1992; Traczyk and Meyer-Rochow 2019).
Icefish growth and reproduction.
Problems in accurately identifying the ages of different species of icefish are not new (Pauly 1978; Mucha 1980; Everson 1981; Campana 1999; Kock 1989a) and have been recognized to affect icefish stock assessments since standard power growth equations using age data were available but expected to generally not reflect true fish growth at all (De Robertis and Williams 2008). There is a persistent lack of fit of the allometric weight-length relationship to the largest and smallest fish in the population, which then results in biased estimates of, for example, population status and biomass (De Robertis and Williams 2008).
The trajectory between power and exponential equations in relation to the growth of adult icefish is frequently presented by only the first equation, but this generates false regional multispecies comparisons of their specific life histories and species strategies. Because of the errors in growth representation and the errors in age estimation vary, other estimates become unreliable. Large, abnormal icefish otoliths (Traczyk and Meyer-Rochow 2022) can indicate reductions in reproductive success (Campana 1999) leading to a decline of biomass. The study of age and growth in fish is basic to obtain information on fluctuations in multispecies biomass (Traczyk et al. 2020) interacting with climatic oscillations (Traczyk and Meyer- Rochow 2019), contributing towards plans of a rational exploitation of fish stocks (Pauly and Christensen 1993; Gonçalves et al. 1997; Binohlan and Pauly 1998). Currently we notice a decrease in body length and age at first spawning (Kock and Everson 1997), reflected by the change of otolith size and mass (Traczyk and Meyer- Rochow 2022); a change that is likely caused by global warming and the consequential decrease of abundance (Whitehouse et al. 2008). This restricts not just food intake but affects the maturation of the gonads as reported for Champ. gunnari (Kock et al. 1991). Much more accurate models, for which reliable age data are a prerequisite, are needed to express the changes and to predict them.
Lack of information about icefish ages and distributions
Fisheries science relies largely on accurate data of fish age and growth. That information is needed to plan a sustainable fishery especially in the vulnerable Antarctic icefish habitats such as their bottom ecosystem (Purser et al. 2022). Determining the age groups of icefishes should be based on the daily pattern of concentric rings, otolith microstructure, and statistical constants, because this ring pattern is permanently recorded and the same in larval (Radtke and Kellermann 1991; Traczyk et al. 2021; Traczyk and Meyer-Rochow 2022) and adult (Traczyk et al. 2021; Traczyk and Meyer-Rochow 2022) parts of the otolith. To more quickly determine the age from the daily increments of otoliths, instead of their manual recognition and counting by several people, e.g. Radtke (1990), they can be automatically identified and counted by tests of the smallest (daily) common oscillation existing in the otolith microstructure pattern (Hammer et al. 2001; Traczyk and Meyer-Rochow 2022).
Otolith age readings (microstructure, shape and mass) also show species relationships with the environment (Traczyk and Meyer-Rochow 2019; Traczyk et al. 2020) and indicate ontogenetic phases including maturity. Daily increments constitute narrow rings of tropocollagen fibers from the sides of rhombic (rhomboids) which have a solid width that remains invariable and wider rings of rhombic eye meshes (filled with aragonite needles, (Gjøsæter and Loeng 1987; Radtke and Kellermann 1991; Traczyk and Meyer-Rochow 2022) that do change in width through the change of the arrangement of the rhombus-eyes, thereby leading to an expansion and squeezing increments that determine species-specific otolith shapes and sizes (Hecht 1987; Schulz-Mirbach et al. 2019; Traczyk and Meyer-Rochow 2022). Young Ps. georgianus make extensive vertical migration to deep, cold water (North 1990) which increases otolith height and creates an additional dorsal growth center (Traczyk et al. 2021). Adults conduct horizontal reproductive migrations to nearshore spawning grounds. That is reflected in their otoliths by increased otolith lengths with a generation of new growth centers at the edges of the otolith colliculums (Traczyk et al. 2021).
Changes during ontology in microstructure of an otolith’s shape as well as the body shapes between species (Hecht 1987; Fisher and Hureau 1985; Froese and Pauly 2024) allow us to better understand the insufficiently known biology of many fish species (living in locations difficult to conduct research in, such as Antarctic deep and cold water or ice-covered areas) and to foresee and stop unwanted effects of climate changes. This would include alterations to or the disappearance of under-ice spawning grounds, the monitoring and safeguarding of the fishes’ main food, i.e. krill (Traczyk 2023; Traczyk and Meyer-Rochow 2019; Traczyk et al. 2020), and the maintenance of all interspecies relationships that determine the fragile carrying capacity of the icy environment of the Antarctic (Traczyk 2023).
Large seasonal differences in numbers, sizes, and distributions among three icefish species, suggest differences in physiology and ecological roles (confirmed by differences of otolith morphology) that were explored by Yan et al. (2013) and have temperature depended oscillations, Traczyk et al. (2020). Ontogenetic phases are temperature and space-separated, horizontally and vertically distributed in relation to depth and temperature around the island habitat from the start of hatching time of the larvae depending on dissimilar food and environmental preferences (North 1990). Ps. georgianus larvae hatch early in the cold winter and rapidly migrate to colder deeper water where small krill larvae are abundant. Adults migrate northeastward to cold Weddell swirls with large krill adults. This behavior supports the development of a higher body (Fisher and Hureau 1985), higher otoliths (Traczyk and Meyer-Rochow 2022), presence of myoglobin in the heart (Jakubowski 1971) and more widely active antifreeze proteins (Bilyk 2011).
By contrast Champ. gunnari and Chaen. aceratus hatch during the warmer spring and develop longer bodies in the strong and warmer surface currents of the West (Traczyk et al. 2020), feeding there on a variety of small plankton organisms. Development of Champ. gunnari closer to the surface supports smaller fish with a more streamlined body (Fisher and Hureau 1985), more compact otoliths (Traczyk and Meyer-Rochow 2022), larger axial muscles (Jakubowski 1971) and adaptations to the stronger warmer surface currents (Sahrhage 1988; Sosiński and Szlakowski 1992; Uva et al. 2000). The adults of the second species Chaen. aceratus slowly but permanently migrate to the cold and slower bottom water from hatching inshore (North 1990), which reaches the north side of S. Georgia moving along the bottom from the southeast and turning westward (Sosiński and Szlakowski 1992), and feed on larger animals (Bilyk 2011). This leads to a bigger body and heart, greater blood volume, wider vessels and a 4 time increase in swimming speed, but concomitant muscle and bone reductions (Żabrowski 2000; Bilyk, 2011). For the pelagically feeding Champ. gunnari, on the other hand, a relatively high caudal fin was noted by Eskuche- Keith et al. (2025) that with muscle and peptide adaptations (Uva et al. 2000) facilitates sustained swimming (Higham 2007).
What needs to be done
Discrepancies of 5–10 years in age estimations of icefish highlight the need of new methods to determine a fish’s age estimation and a detailed analysis and knowledge of otolith microstructure is what is needed (Traczyk et al. 2021). Interpretation of icefish otolith microstructures in relation to counts of annual and daily increments is difficult for adult fish (Mucha 1980; Everson 1981; Coggan and White 1986; Kock 1989a; Agnew and Kock 1990; North 1990; Sosiński and Paciorkowski 1993; Traczyk et al. 2021; Traczyk and Meyer-Rochow 2022). Interpretation of annual otolith increments performed by specialists from around the world on a variety of species provided very different estimates for members of age groups of 1 to 17 years of age with an error of 8 ys for readings of the same otolith (Campana 2014 cited in: Geffen and Morales-Nin 2015). Because of such uncertainties, we were applying for age estimates of icefish species new automatic recognition techniques and counts of daily otolith increments (Traczyk et al. 2021; Traczyk and Meyer-Rochow 2022). Our detailed studies of Ps. georgianus, Chaen. aceratus and Champ. gunnari otolith microstructures, then allowed us to determine how and why they form and to relate particular patterns and composition to growth, age groups, and life histories as has successfully been done for non-polar species (Ragheb 2023).
Additionally, the traditional fish growth equations such as those devised by Von Bertalanffy (Pauly and Morgan 1987), revisited by Pauly (2019a), involving power body length relationships, do not necessarily correctly represent fish growth for certain species (e.g., icefish). There are suggestions to choose L∞ from length data and to apply averages of length for the estimation of growth equations by regression analysis (Lugert et al. 2014; De Robertis and Williams 2008), but once again even they have their limitations when using them in connection with species with very different lifestyles and environments.
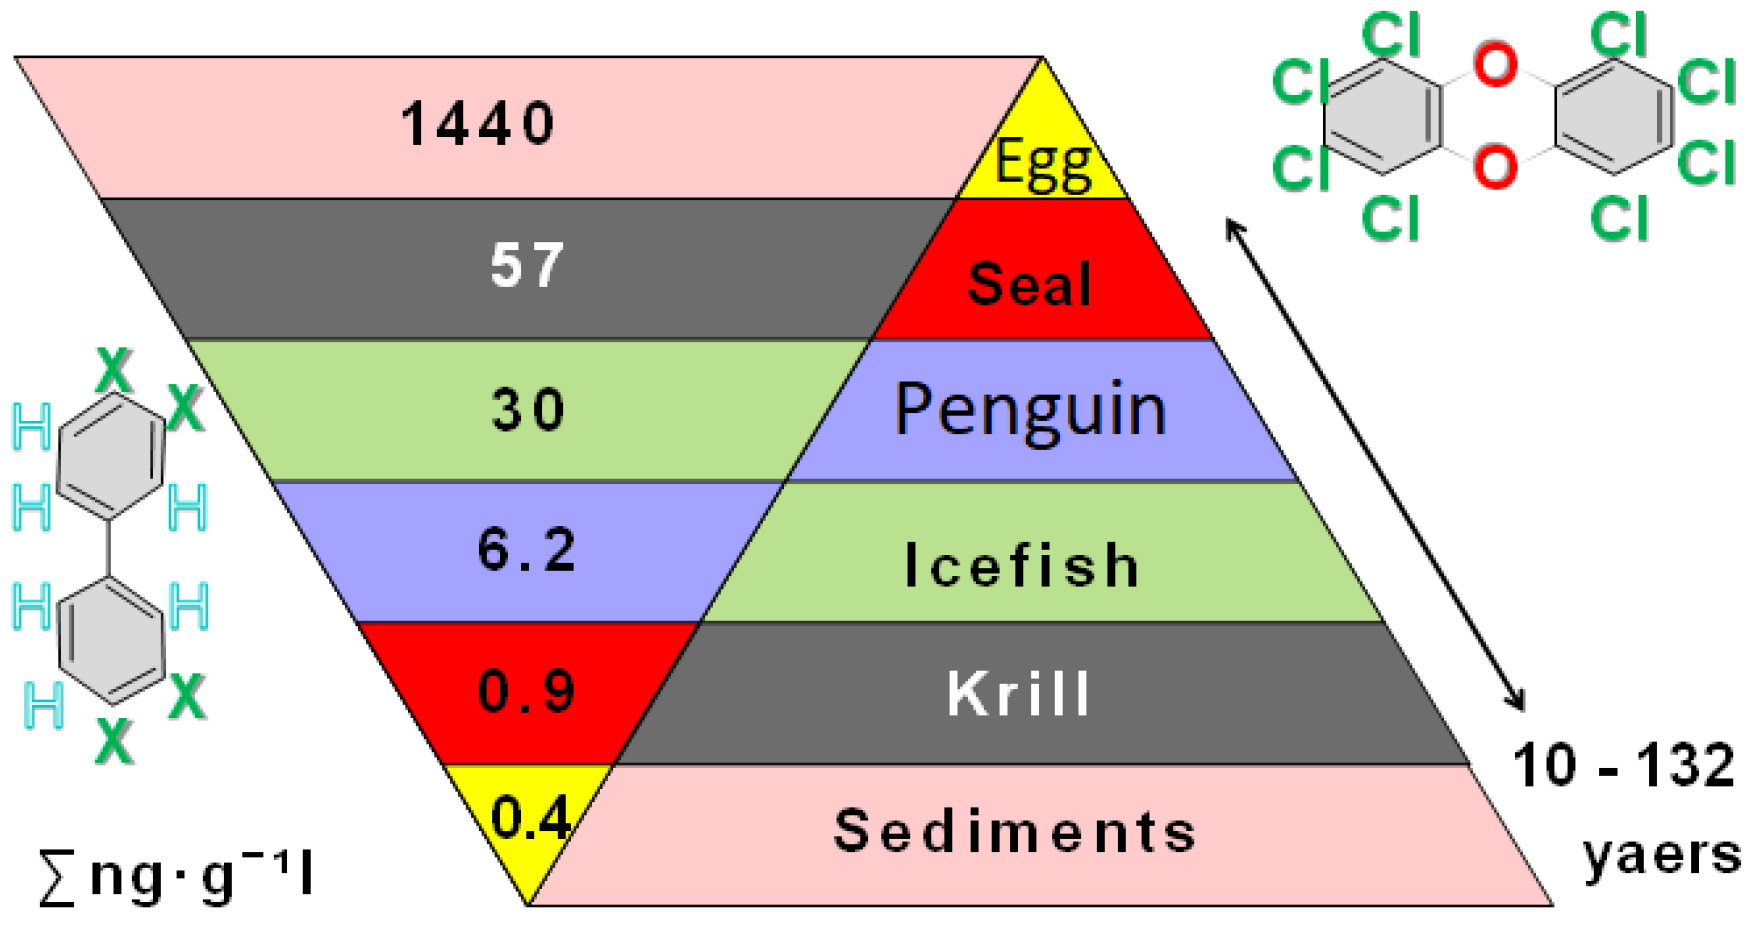
We need comparisons of age estimations from otoliths of different species and to explain differences between the species we must take into account variations in otolith shapes. Such variations can be the outcomes of different in habitat preferences, dissimilar behavioral patterns and also contaminations (Xie et al. 2022), the latter accumulating at the bottom, especially near Antarctic research stations (Meyer-Rochow 1999; González-Pleiter et al. 2021; Caruso et al. 2022; Xie et al. 2022) at levels as high as those in the Baltic Sea (Bargagli et al. 2005). Involuted otoliths are useless for age estimation, but can be used to explain reasons why spawning grounds may not be reached, why the numbers of large white-blooded fish decline and, more generally, why species numbers and abundances are decreasing.
CCAMLR conclusions and recommendations
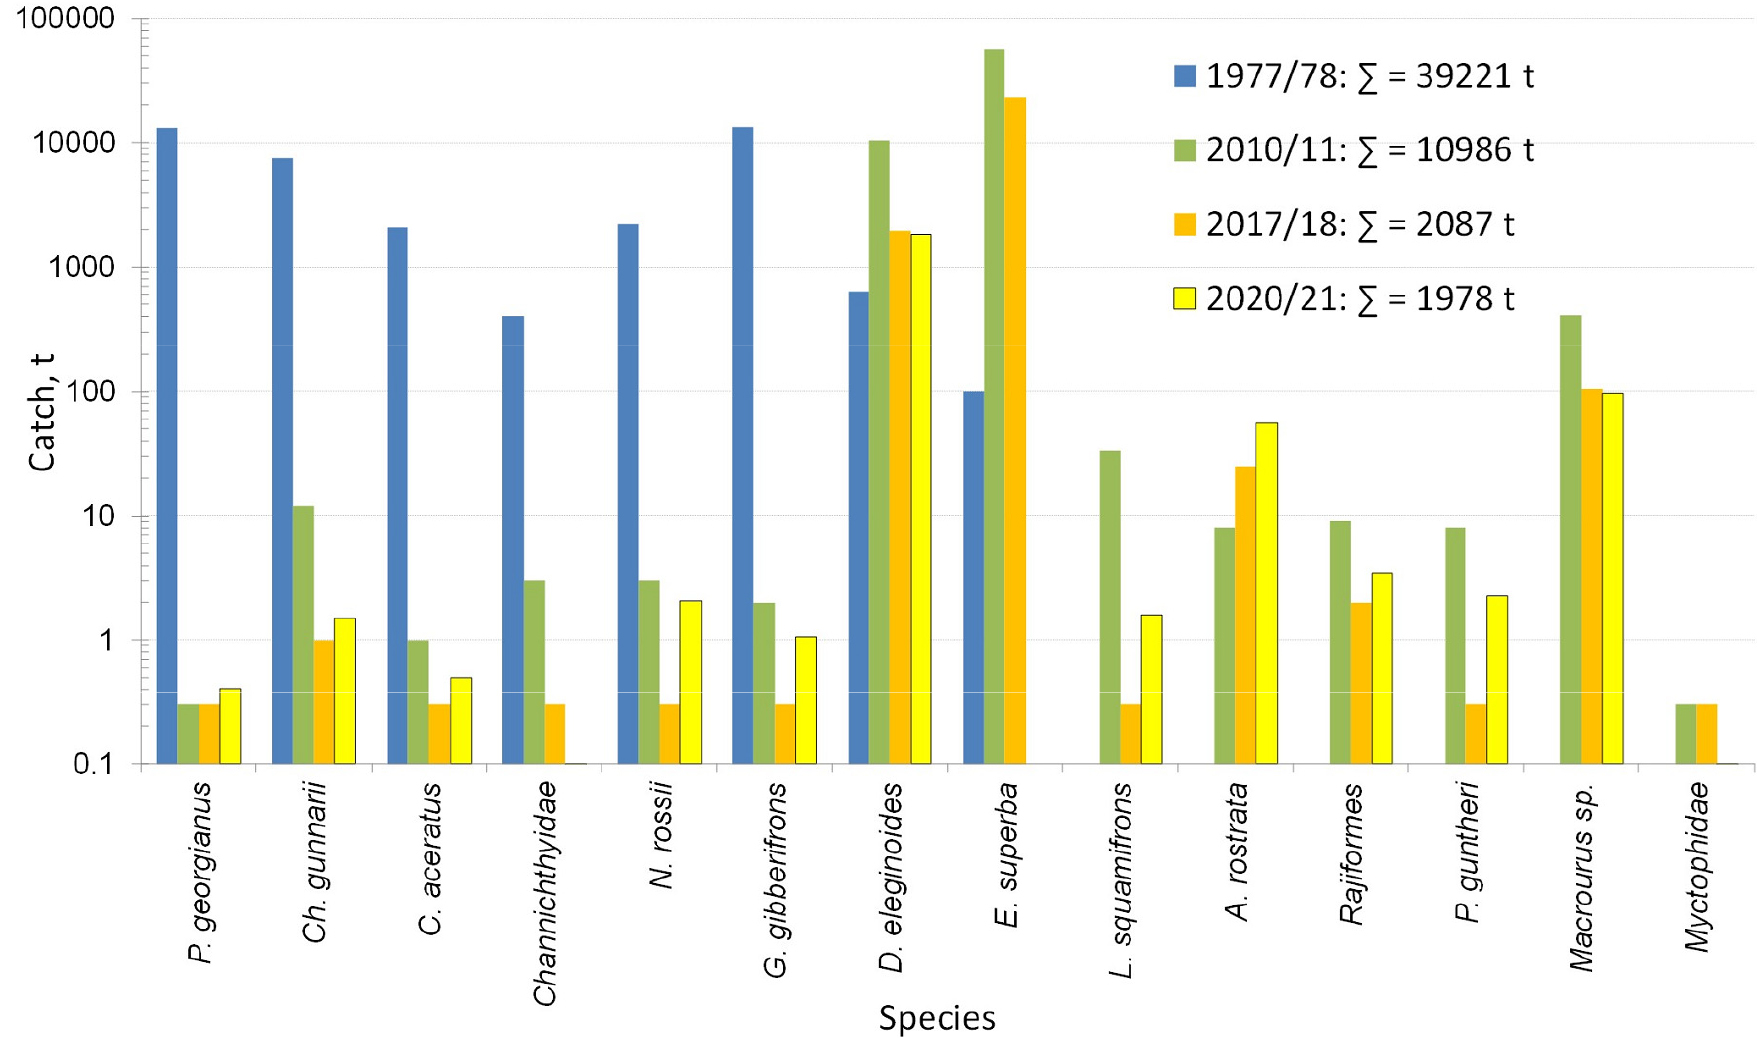
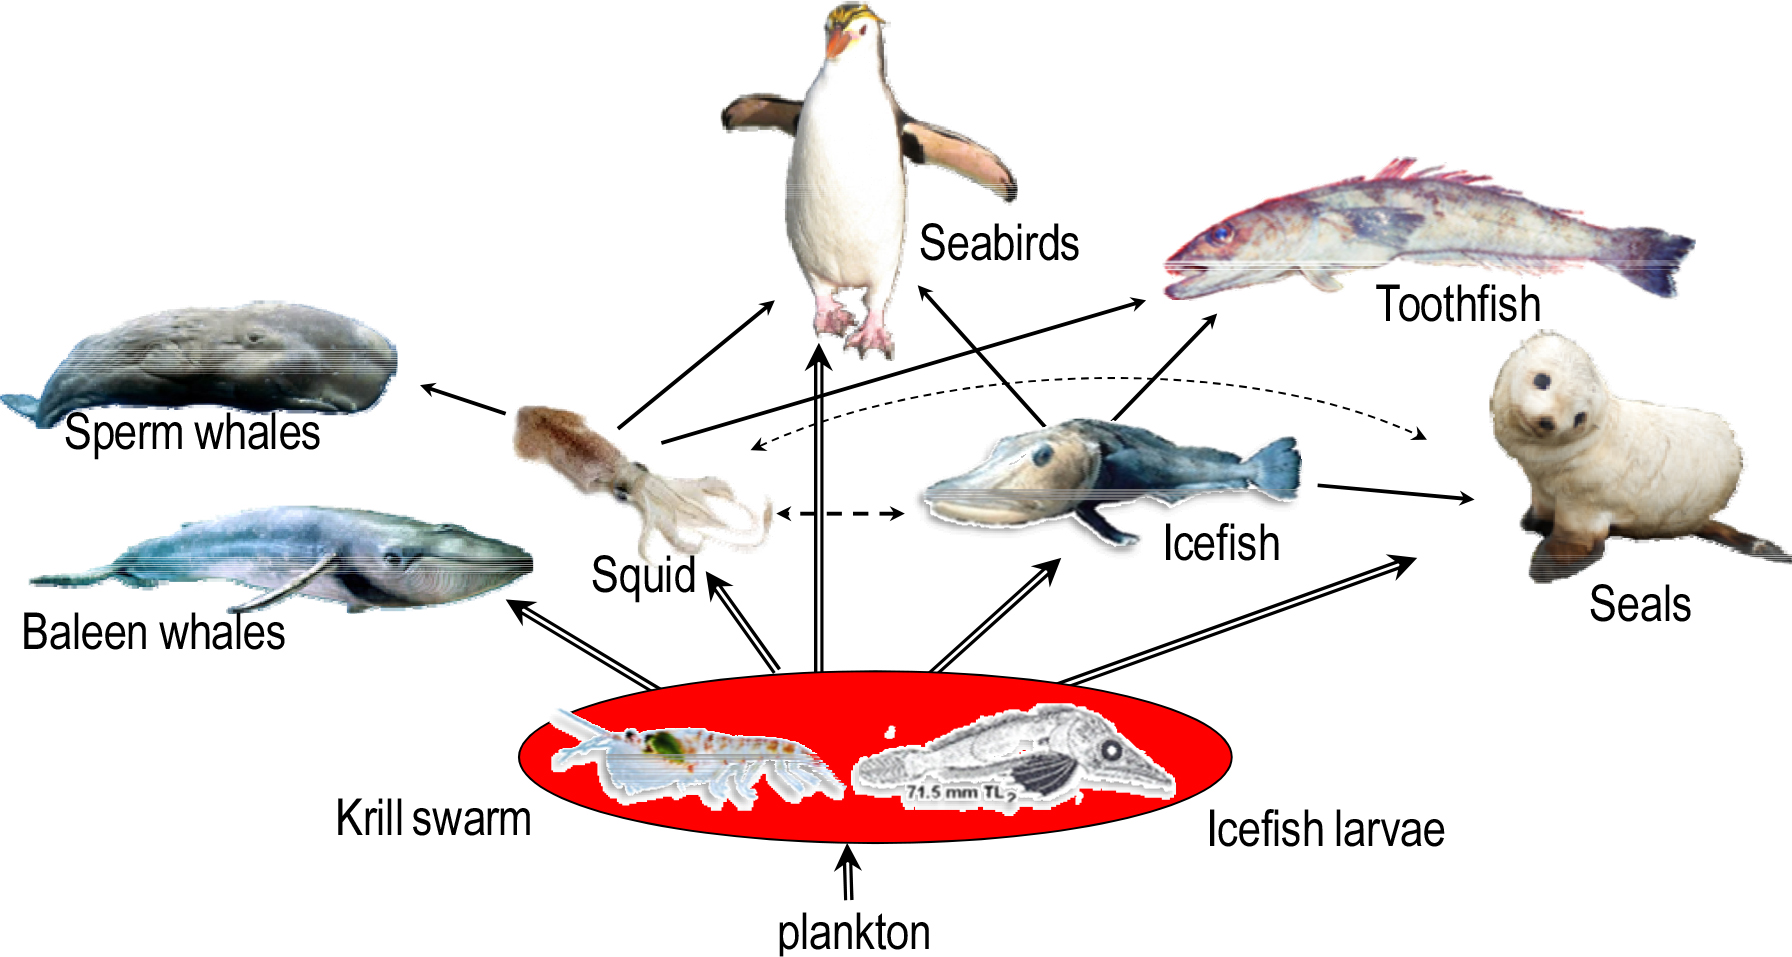
In recent years fisheries have yielded very low catches indicative of a low biomass of icefish (information available on request from the: Commission for the Conservation of Antarctic Marine Living Resources, Hobart/Tasmania, Australia) that exclusively feed on krill. Currently the Science Commission for Saving Antarctic Living Resources (CCAMLR) noted that increased monitoring of both krill and krill-dependent predators is required (CCAMLR 2022, 2023, 2024). Further investigations into the spatial patterns in species composition and habitat relationships in analyses of the trophic interaction between icefish and Antarctic krill (Euphausia superba), i.e., their dominant prey, were recommended, CAMLR sec., 2023, 2024. Taking into account climate change is a necessity, including the tracking of population parameters through time. In addition to information on krill biomass, recruitment, age and sex structure, information is needed about krill-dependent species from icefish to whales and their interrelationships, the state of the resources, seasonal distribution and possible impact of increased catches on the Antarctic ecosystem. Otolith analyses, pivotal in age studies, can also yield useful information on the degree of contamination.
The use of older data based on data of fish from various regions and zones, covering habitat changes and involving preserved specimens plus modeling interspecies and climate relationships, allows us to estimate key species- specific biological parameters especially for the three icefish species under discussion and to assess their associated variability in adapting to different environmental conditions. Therefore, the aims of this review were to estimate and compare the growth rates as well as lengths and ages at maturity of the three icefish species on the South Georgia shelf between the 1970s to the 1990s with those presently known (Froese and Pauly 2024), paying special attention to the ages of those fishes whose stages and rates of development are known.
2. Material and Methods
Our data and results may be used in connection with other aquatic research in Antarctica, because they satisfy unification and standardization of methods of recording catches and research, developed by the international science commission of CCAMLR. Data on Champ. gunnari, Chaen. aceratus, and Ps. georgianus were collected from 1972 to 1992 during the southern summer months of December to February off the S. Georgia Shelf through the use of pelagic and bottom trawl surveys. The research involved international scientific teams on several research vessels, using standard methods (CCAMLR sec. 2023a, 2023b, 2023c; Everson et al. 1992, 1999). Detailed information describing sampling procedures and areas are in the annual reports from meetings and activities of the Fish Stock Assessment body of Scientific Committee of the CCAMLR (e-sc-41-rep.pdf), available from CCAMLR. org (CCAMLR sec. 2023a, 2023b, 2023c; 2024) and publications (Traczyk and Meyer-Rochow 2019; Traczyk et al. 2020; Sosiński and Szlakowski 1992; CCAMLR 2024, 2025). Immediately after collecting the fish, every individual was measured (total length), weighed, macroscopically sexed, and had its sagittal otoliths extracted and stored under dry conditions. Sample data and otoliths were obtained from the CCAMLR Fish Stock Assessment data (CCAMLR 2024, 2025) uploaded from monitoring programs of estimations of relative abundance of demersal fish species of commercial interest, undertaken by the USA, Poland, UK, and Germany for 5421 Champ. gunnari, 571 Chaen. aceratus, and 2118 Ps. georgianus, CCAMLR (2024).
Organic tissues were removed from the otolith surface by immersing the latter in Clorox (5.25% sodium hypochlorite). The otoliths were then rinsed in water, dried, and weighed to an accuracy of ± 0.00001 g. Otoliths were chosen as the most suitable structure for age determinations (Kock 1989a; Radtke 1990) based on otolith microstructure (Traczyk et al. 2020; 2021). Icefish ages were determined from daily increments in otoliths space and mass and then used to investigate age structure based on percentages of age according to total length transposed to mass measurements. Therefore, day increments (narrow, discontinuous zones of minimum density) and night increments (wide, continuous zones of maximum density) were automatically tested and counted, producing 24-hour records of smallest period: max-to-max deposition densities (Traczyk et al. 2021). The advantage of our automatic analysis of daily increments over earlier manual counts by Radtke (1990) was already explained in detail by Traczyk and Meyer-Rochow (2019, 2022) and used in analyses by Traczyk et al. (2020, 2021).
Since micro-incremental readings are very time-consuming, and do not allow quick age estimates (yn) for the n = 500 - 1000 individuals needed annually to establish catch limits or significant numerical changes in the population, the results of tedious age readings from daily otolith increments are assigned via the equation-function f(x) to the explanatory "i-th" number of variables (xi). They are easier to measure, and therefore, thanks to this function, provide a faster age estimation of the required 500–1000 individuals per year. Usually the variables xi are: 1) otolith mass, OM, 2) otolith height, OH, 3) otolith length, OL, 4) otolith volume, OV, 5) body mass, BM and 6) total body length, TL - all introduced into the function defining age, y: f(x) =y= a + b1x1 + b2x2 + ... + bixi, where a = point of intersection of OY axis, bi = regression coefficients. Out of them, the multi-step regression method, at the level of inclusion of variables p≥ 0.05, eliminates those variables that are less distorting the explanatory variable. The parameter most influencing the number of increments is, as can be expected, the otolith mass, which provides a linear relationship: Age = A∙ (otolith mass) +B. The age of fish equal to the number of daily increments increases in direct proportion to the increase in the mass of the otolith, as increase in space by adding new elements must increase with the otolith’s mass (in contrast to otolith morphology with only one parameter such as OH without the OL with colliculum being considered).
The basis for describing fish growth with age is the linear model of a directly proportional length increase and it has existed since the beginning of fisheries: a larger fish is an older fish. It is known that during certain periods of temperature change, egg production, and aging, growth rate decreases, while it tends to increase when fish move to greater depths. To account for this, a periodic function with a period equal to the fish’s size at which the change in growth rate occurs can be added to the basic growth function (linear, Bertalanffy, or another equation). Such a combination of functions will more accurately describe the growth of fish experiencing several changes in growth rate associated with different periods, i.e. growth stages, and enhance our understanding of the species' biology.
The discovery of a strong linear relationship, a steady increase in the otolith mass along with the number of daily increments, allowed us to estimate the age of fish from the position of the otolith mass of the fish in relation to the peaks of the otoliths’ mass frequency. This determines age groups of close members. For the mass of an individual's otolith, a given age group corresponds to the nearest peak in the mass frequency data of the otoliths; and a more accurate age estimation depends on the position of its otolith mass in relation to the nearest peak. If the mass of the individual's otolith was lower than the peak value, the age of the individual decreases with the part of the year (number of days) in proportion to that which shows its otolith’s mass reduction from the nearest peak. If the mass of the otolith was greater than the peak of close members, this greater mass of the otolith proportionally increases the age of the fish. Furthermore, the component, related to the year of the catch from the month of hatching, increases in each age group.
Because of the above discovery, we used otolith mass and fish length in parallel to determine age groups from otolith mass frequency and body lengths (Lassen 1988). The resulting age group distributions were further corrected by using Solver software to fit all of them to otolith mass frequency curves by minimizing the sum of their squared difference (Laslett et al. 2004). The mean sizes of fish in each age group derived from analyses of multimodal otolith mass distributions were approximated by linear equations (Glen 2015). Ages of the smallest length-group of 7 cm TL post-larvae, collected in January, were judged to be 0.5 years of age, based on the icefish’s fast growth (∿10 cm・y-1) and their 5–7 months earlier hatching as 1.5 cm TL individuals in June–August (North 1990). Subsequent age groups in otolith mass may have normal or log-normal distributions (Huxley 1932), separated by one-year mass gains. Age groups determined by proximity in size-otolith masses of their components to their averages have a better age separation then age groups estimation from relationship of otolith age data of otolith sample from their otolith mass directly tight to equation trajectory. Also, earlier icefish growth estimates lacked data for very young individuals, because catches focused on larger, older fish (Sosiński and Paciorkowski 1993), leading to underestimations of year-0 size fish and fish, which had their ages assessed at maturity and when growth had apparently ceased (Skeeles and Clark 2023). The result of this neglect is a bias in estimates of carrying capacity, especially in remote icy environments with limited fishery data.
For each icefish species, we fitted to their total lengths the age and otolith mass data through the Von Bertalanffy growth model:
Lt = L∞ {1 – exp[-K(t-t0)]}, where:
Lt - length at age with time in year [y] of life;
L∞ - asymptotic length at which total-length growth is zero, fitted with initials: L∞ = 1.05·Lmax (Gubiani et al. 2012)
K - growth rate relative to L∞, i.e., how fast the fish reaches its maximum size and indicates habitat quality (Palomares et al. 2022).
t0 or L0 - age at which fish have zero size or length at start of life (Smart et al. 2016).
Because of the large change in Chaen. aceratus life strategy from juveniles to adults (e.g., according to Bilyk (2011) larger prey and 4 times faster swimming speed: and absence of data on larger males that could change the input), a harmonic (Somers 1988) to express possible changes was added to their growth curve (Hampton and Majkowski 1987; Sparre and Venema 1998).
Body mass to body length relationships were approximated by BM = aTLb, using minimized sum of squared differences between data and modeling in the Solver procedure of Excel. However, power relationships do not show maximum sizes (De Robertis and Williams 2008) of data located between the power and exponential models that describe species relationships to carrying capacity, which is why we felt it was necessary to add the exponential equation (Huxley 1932; Lugert et al. 2014; Ragheb 2023) and harmonic and sigmoid equations to the other empirical data (Hampton and Majkowski 1987; Sparre and Venema 1998; Parkes et al. 1990). These methods are superior, because they extend the high accuracy of determining age relative to the length of the fish, by accurately expressing the mass of the fish from this length (which determines gonad production and fish fecundity).
The maturity stage was determined macroscopically and recorded at sea using a five-point gonad scale suggested by Kock and Kellerman (1991): 1) Immature, 2) Maturing Virgin or Resting, 3) Developing, 4) Gravid, 5) Spent, used also by Everson et al. (1996). Gonadal macroscopic maturity stages were validated by histological observations (Macchi and Barrera-Oro 1995; Militelli et al. 2015; Novillo et al. 2019). Although they indicate inner and interspecies specific variations in the reproductive parameters, they do closely agree with the notion that icefish spawning takes place only in one seasonal period each year (Kock and Everson 1997). This is verified by yearly increments to distance between the neighboring prominent peaks in the frequency of TL or other descriptive body and otoliths parameters. Larvae hatch in a species after species order: Ps. georgianus, Chaen. aceratus, Champ. gunnari (North and White 1987; North 1990) in concert with the decrease of the antifreeze properties of each species (Bilyk 2011). Hatching, occurring only in one seasonal period per year (Kock and Everson 1997), determines that the age groups are separated by at least yearly increments of body and otolith sizes. Lengths and ages at first spawning (include reproductive fish stages ≥3), which corresponds to length at first maturity (Kock 1989b, 1990, 2005) length at which 50% of the population spawns for the first time (Clarke et al. 2008), were estimated by fitting a logistic growth function to the cumulative proportion of mature individuals at different total lengths (Kock 1989b) and ages (or: tm-sp = t0 - ln(1 - Lm-sp / Linf) / K.). Statistical analyses were conducted in Excel (Salim and Thekra 2009). The biomass of icefish was estimated by the swept area method as used by, for example, Mucha (1980) and Sosiński and Szlakowski (1992).
3. Results
Icefish age estimation
In January 1990, larvae of 155 Champ. gunnari, 200 Ps. georgianus and 31 Chaen. aceratus were obtained from the shelf waters of S. Georgia Island. They were 6–8 cm long and their ages were estimated to be about 0.5 yr using 3 methods. 1. The number of daily increment rings seen on the otoliths’ cross sections (158; 286; 284 daily increments) (Figs. 1, 2, 3), which are a reflection of the daily migrations of these larvae (Fig. 4). 2. Yearly increments of otolith mass, being for Champ. gunnari on average 0.00345 (± 0.00034) g・y-1, for Ps. georgianus 0.01174 (± 0.00273) g・y-1, and for Chaen. aceratus 0.00721 (± 0.00178) g・y-1. Postlarval 6–8 cm TL icefishes (first prominent peak values on axis of total length) have a much smaller otolith mass (approximately 0.0001, 0.0022 and 0.00026 g) than half of the yearly increments of otolith mass (Fig. 5) indicative of an age of no more than 0.5 y. 3. The following average values of first yearly increments of total length among young Champ. gunnari of 11.9 (± 0.88) cm・y-1, Ps. georgianus of 12.98 (± 1.01) cm・y-1, and Chaen. aceratus of 11.24 (± 1.57) cm・y-1 were obtained. Postlarval 6–8 cm TL icefishes (first prominent peak values on axis of total length) have much smaller total lengths (approximately: 6.5, 8.0 and 8.0 cm) than yearly increments of total length (Fig. 1, Table 1) again indicative of ages less than 0.5 y. The above age estimation confirmed the field data of the presence of small 1.6 to 2.1 cm long newly hatched larvae that were reported in June–August.
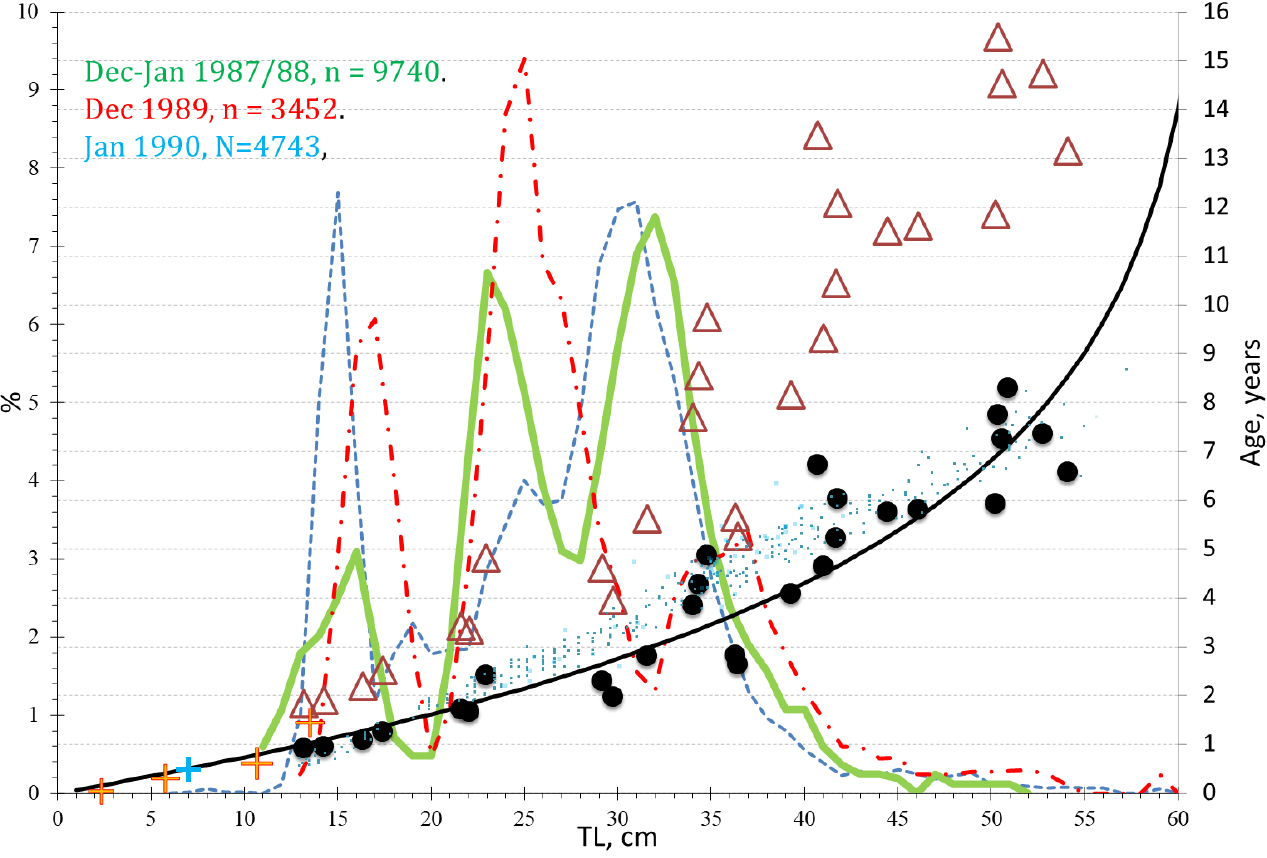
Fig. 1.
Age estimation and transformation of published icefish age data with respect to agreement with groups of close neighborhoods in length distributions of Champ. gunnari from S. Georgia. ∆ - age estimated by Radtke (1990) based on manual SEM microincrements counts; ● = ∆∙2-1 = half–values of manual age estimates by Radtke; + = age estimated on the basis of automatically counted daily increments and tested as in Fig. 2; ∙ = half-values of calculated age estimates based on otolith morphometrics and fish body lengths by Radtke (1990); black curve = Von Bertalanffy curve fitted to daily increment counts (●, +); curves: green, red dotted dashed, and blue dashed refer to the total length frequencies for the respective catch periods: Dec–Jan 1987/88, n = 9740 (green solid line); Dec 1989, n = 3452 (red broken line); Jan 1990, n = 4743 (blue dotted)). On left test, Δ=0.0024 mm for otolith from S. Georgia 6.5 cm SL icefish. As the common Δ covers 180 days (0.5 year) along R9 = 0.43 mm including first 32 of Δ=0.0015 mm in larval nucleus, R9 = of 0.048 mm. On the right Δ = 0.0015-0.00225 mm for otolith from S. Shetland Islands of 1.7 cm larvae along radiuses R9,6,4, = 0.065 mm as common Δ appoints 30–28 days including first 9–6 days from primordium, R9=0.016 mm. (d, e) Fitted to the profile of collagen optical density (red line), sum (black line) of 9 initial fluctuations (blue lines) reveals by harmony analysis, the smallest common daily period T3 = 0.0024 mm for otolith from S. Georgia icefish (main graph). For otolith larvae from S. Shetland (subgraph E) the analysis of harmonics reveals the five smallest common daily periods T2,3,4,7,8 = 0.0018-0.0024 mm. (f) On the left, the optical density profile (red line) and parallel moved copy (green line) to follow the daily increments in an otolith of 5.5 cm TL Champ. gunnari from S. Georgia on March 2002. On the right: (indicated by arrow) a daily increment (Δ) from tests being in the range of 0.0018–0.0026 mm, agrees with a Δ covering 137 days along a radius R = 0.5 mm
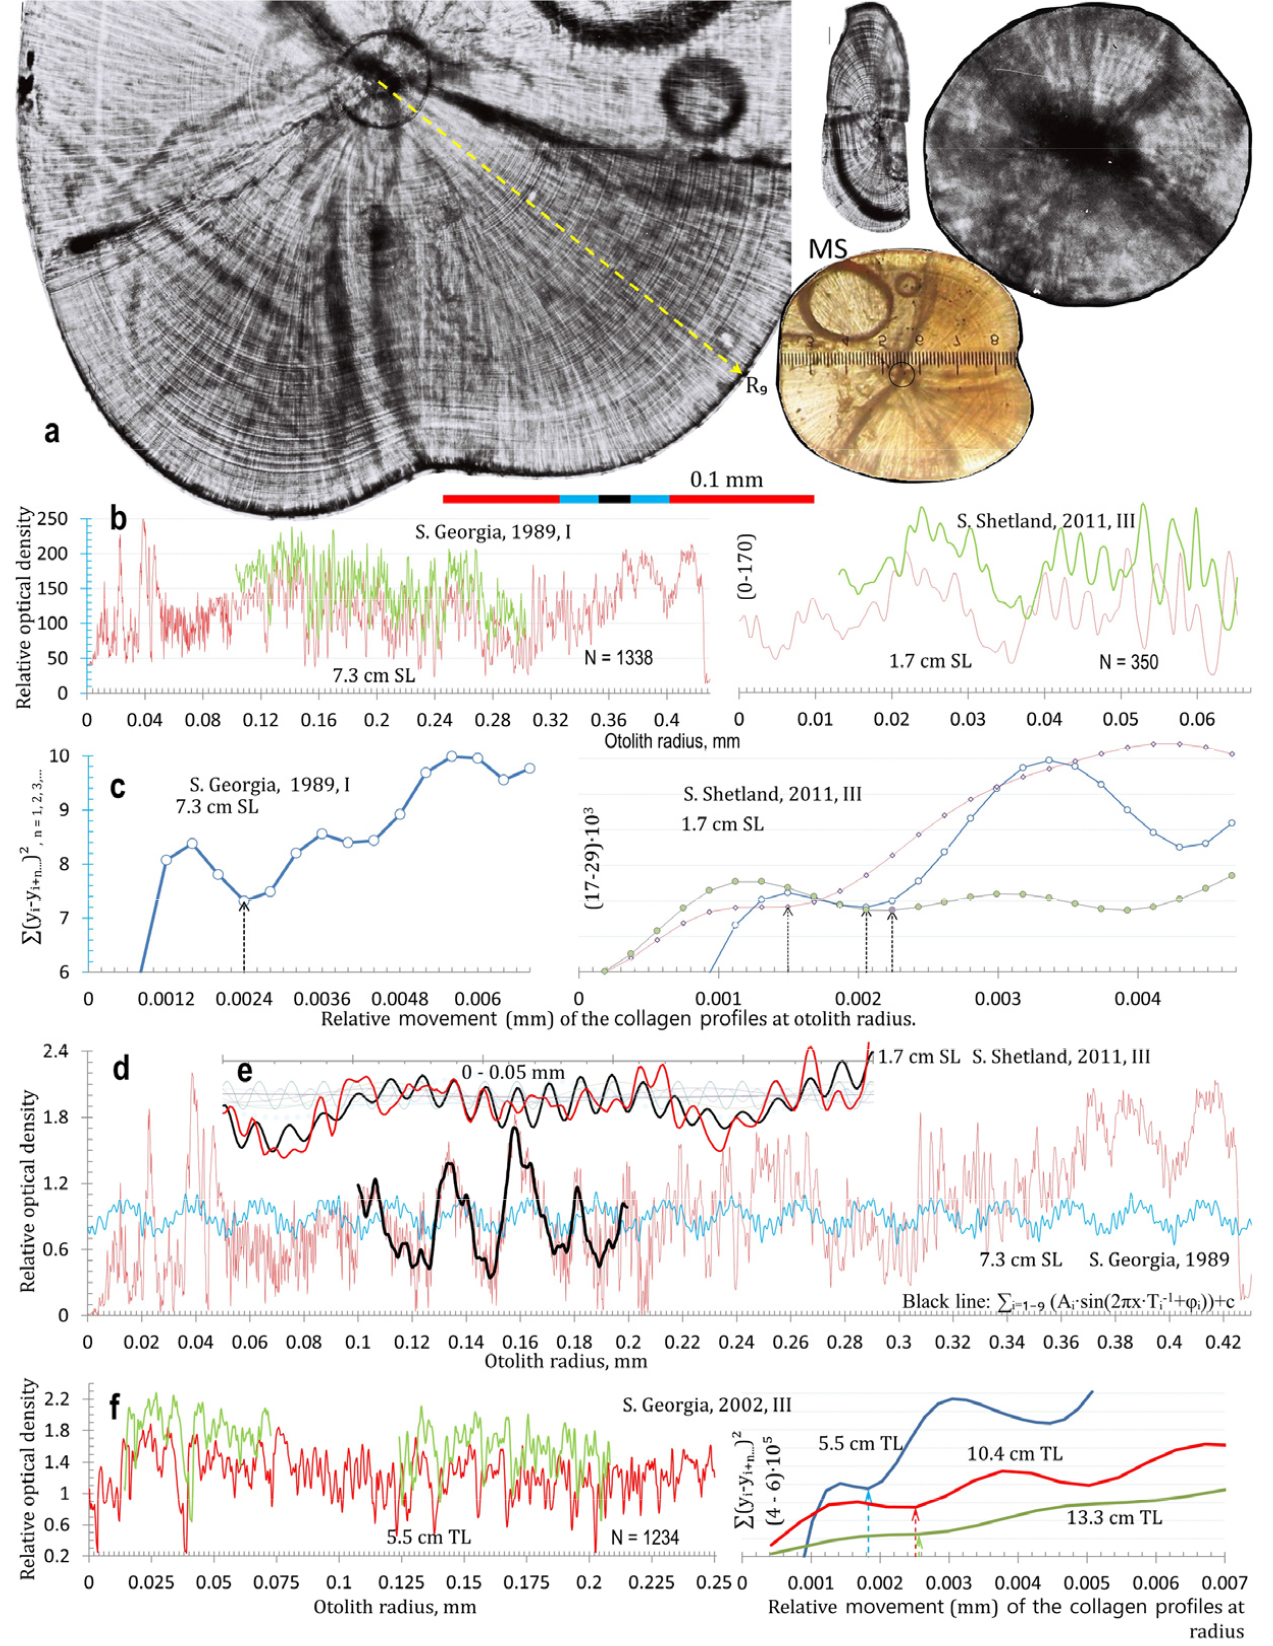
Fig. 2.
Age estimated on the basis of automatically searching, testing and counting of daily increments (without a personal influence in manual counting) from microincrements pattern determined from surfaces of median-sagittal (M-S) sections of otolith Champ. gunnari living in different Sub- and Antarctic climatic zones. (a) On the left and middle: large otolith, with radius R9=0.43 mm of 6.5 cm TL icefish from S. Georgia at Jan 1989. T and MS - transverse and median-sagittal plane. On the right: small otolith with radius R9= 0.065 mm of 1.7 cm SL icefish larvae from S. Shetland in Feb. 2011 approximated). Scale bars, 0.1 mm: black - entire profile in natural position in the centre; blue, enlarged on the left; red larval nucleus on the right. Yellow dashed line - density measurement from centre to otolith edge along radius R9. (b) Optical density profiles (red lines) of radial growth of collagen and digitally shifted copies (green lines) to discover smallest daily shared increments in otoliths. Left side for S. Georgia, right for S. Shetland. (c) Daily (indicated by arrow) increment (Δ) from test (first minimum in sum ∑(x0-x6)2 of dislocated profiles

Fig. 3.
Testing of fish otolith daily growth as a space-time unit by comparing it with daily increments from tolith sections and their optical density profiles of another species, 19.8 cm TL Ps. georgianus, rather than Ch. gunnari using different techniques. (a) From the otolith central primordium (CP) inside the larval nucleus along radius R9 = 0.098 mm, 46 daily rings radiating with a common Δ = 0.0013 mm, but outside the larval nucleus with a wider Δ = 0.0021. Below the otolith density profile data (yellow line) are fitted with harmonics (black line). (b) Otolith density profile of overall radius (red line) from otolith of 19.8 cm TL adult with dorsal radius of 2.13 mm and 619 daily increments in automatically deduced consecutive relative maxima (above average oscillation - black line) under microdensitometer - see below. (c) Interdisciplinary testing, diagram of measurements of daily increments 5) at the lab of experimental physics. Average width of daily increments: Δ = 0.00383 mm, but generally decreasing, expressed by: y = -0.0004x + 0.0039 (dotted line)
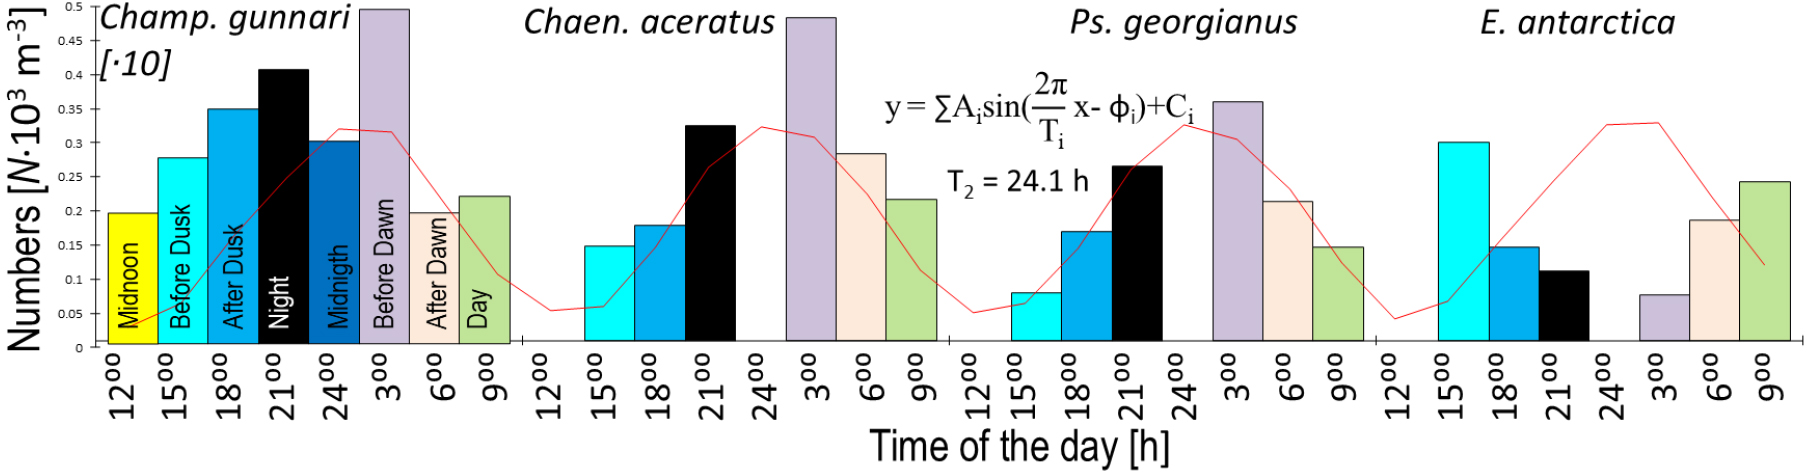
Fig. 4.
Daily vertical migration time scale periodicity to which daily increments in otolith (collagen at night, aragonite at daytime) can be related. Testing of fish otolith daily growth as a biological record of the daily physiological rhythm underlined by daily vertical migrations (crossing sound canal). Changes in the number of fish larvae at different times of day over the S. Georgia Shelf (based on data suggested by North 1990) with fitted daily period. Ps. georgianus and Chaen. aceratus before darkness give the lowest numbers (dispersion indicates aragonite deposition), while maximum numbers (concentration indicates slow swimming and higher collagen synthesis) are recorded before dawn. E. antarctica has a reverse trend with growth during the day but not at night and Champ. gunnari have up to 3 minima, one each at midnoon, midnight and just after dawn, which then gives a period of 12 or somewhat fewer hours
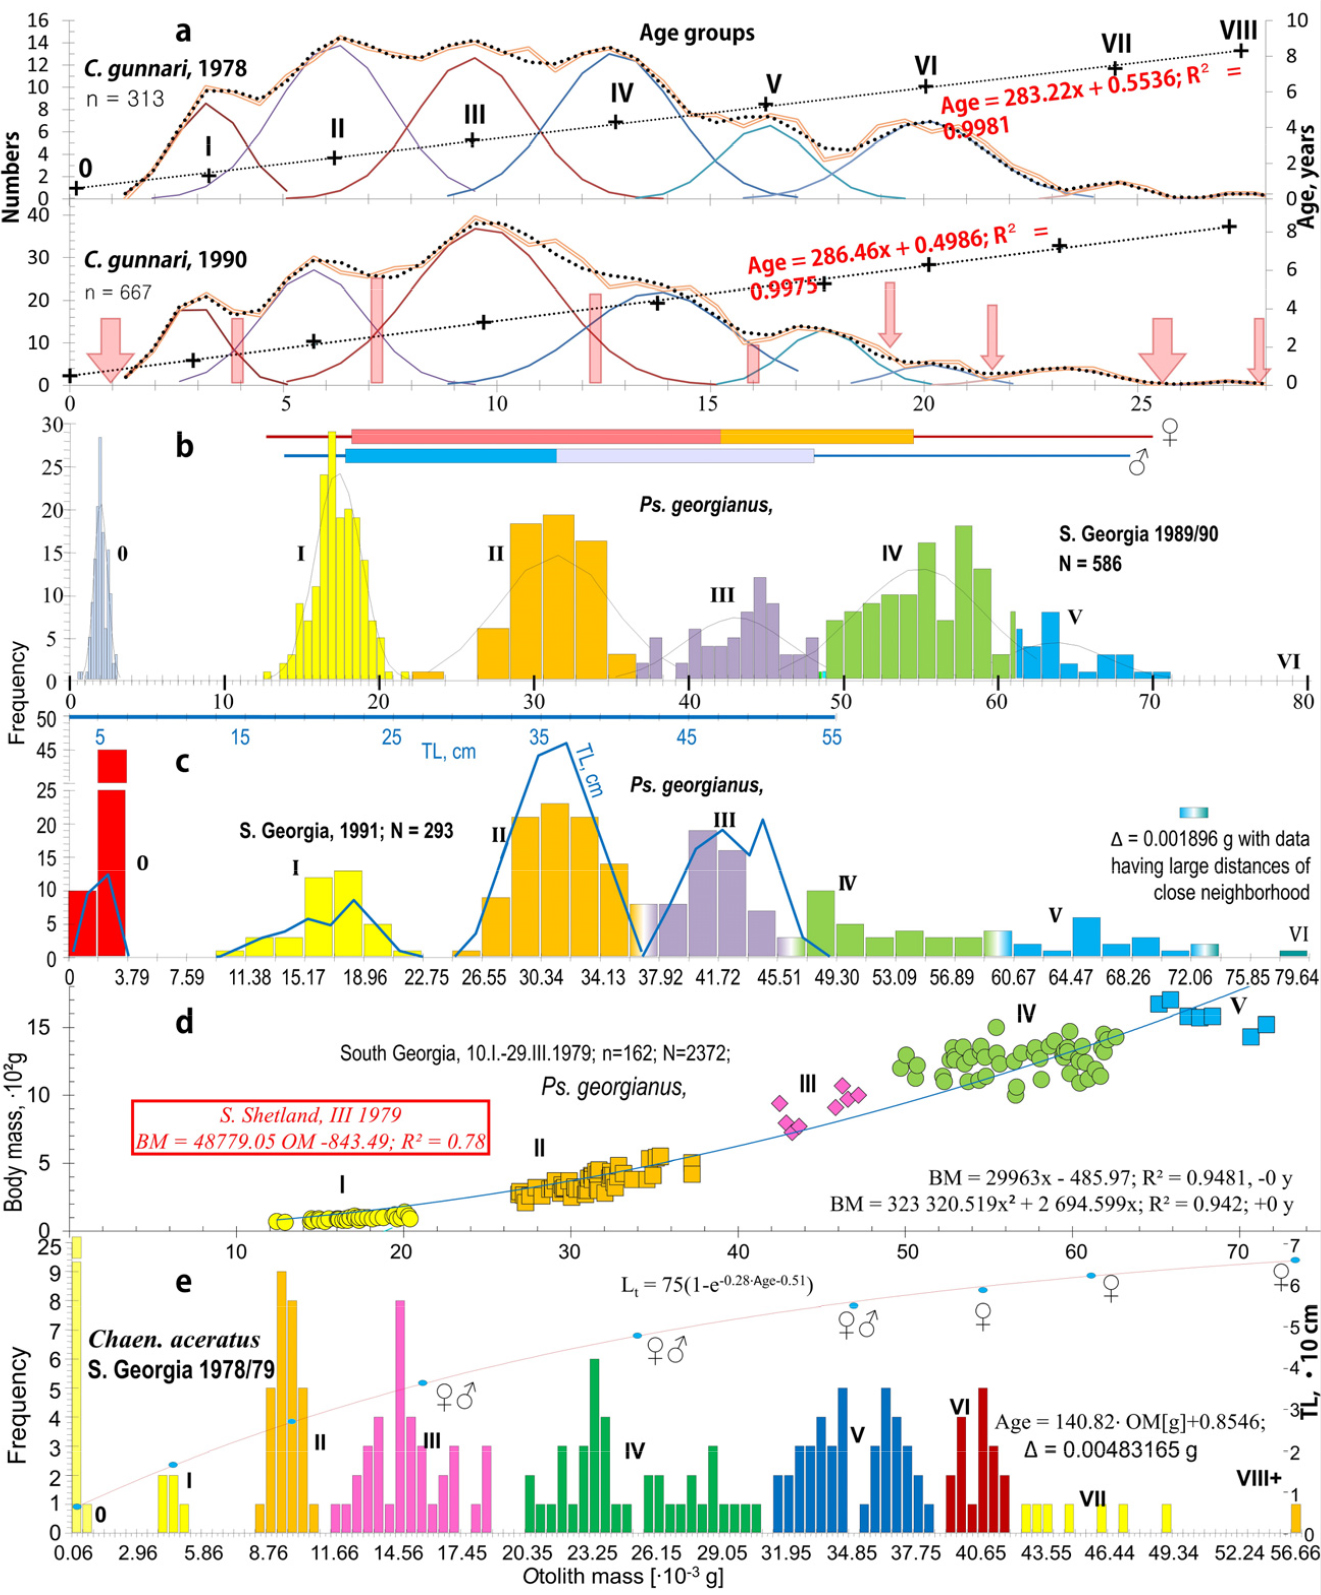
Fig. 5.
Otolith mass and age groups (roman numerals) fitted to empirical otolith mass data in 3 species: in the range 0–0.028 g, Champ. gunnari has all 0–VIII age groups; Ps. georgianus has only 0–I age groups and Chaen. aceratus 0–IV age groups represented. This indicates that otolith mass of Champ. gunnari should be measured with greater accuracy to more clearly separate age groups as it is for length frequency (see Fig. 1). (a) Age groups of Champ. gunnari with normal distribution (single lines) in mass class, sum of those (dotted line) were fitted to empirical otolith mass data (double line) in 1978 and 1990. Crosses (+) are averages of otolith mass at specific age groups, which give age estimates directly from otolith mass (OM) by regression line analysis (dashed line): YAge = a‧OM +b. Red vertical bars and arrows represent result of separation of age groups in agreement with regression (not with normal distribution which is shared with neighbour age groups - the marginal small counts from the maximum and minimum of the range due to the inability to increase measurement accuracy of the otolith mass. (b) & (c) Age groups of Ps. georgianus that are separated by large distances between age groups in frequency of otolith mass with variable class widths based on year 1990 and constant based on year 1991, Table 2. (b) Increasing the accuracy of otolith mass measurements of the age 0 fish group in narrower frequency classes reveals its normal distribution. (c) The low accuracy of the measurement of age group 0 does not preserve the nature of its distribution. The otolith mass frequency (vertical bars) has 7 modes associated with the age groups in which only the first 4 have the same association with age groups in frequency of the fish’s total lengths (black line) - indicating the beginning from age group IV–V of the pause of somatic total length growth. Total lengths of the fish from age group V, being the one after the first spawning, are not used for age prediction and only otolith mass (which does not pause but follows a constant growth) can be used. (d) Age groups between close neighbors regarding otolith and body mass of Ps. georgianus from S. Georgia in 1979 with fitted linear regression. (e) Age groups of Chaen. aceratus that are separated by large distances between different groups in frequency of otolith mass fitted by Von Bertalanffy equation through a linear relationship that adjusts the mass of the otoliths to the age of the fish. The last adult age groups VI, VII and VIII+ consist of only females
Table 1.
Age groups of Ps. georgianus in otolith mass separated by large distances of closer neighbors (CN) between age groups and about 10 times smaller between fish of the same group
Patterns of daily increments in otoliths reflect biological cycles of daily vertical migrations. During the 24 hours a drop in the number of larvae was discovered two times, namely “after dawn” and at “noon” for Champ. gunnari, but only once, i.e., “before dusk” in the other two species, Ps. georgianus and Chaen. aceratus (Fig. 4). The latter two species appear to have a more obvious pattern of daily increments in their otoliths, (e.g., Ps. georgianus: Fig. 3). By comparison, Champ. gunnari, because of their less regular daily migrations, exhibit twice as many irregularities in their otoliths’ daily increments (Fig. 2).
Otolith mass frequencies in Champ. gunnari were essentially unchanged from 1972 to 1990. They have the same multimodal histograms, show the same distinct peaks (modes - local maxima = modes having large anti-modes), indicating the presence of separate age groups (Fig. 5, Table 1) that exhibited the same averages (peaks) over the first 5 age groups despite the 12 years that had passed from 1978 to 1990. A constant growth of the otolith mass is essential for the otolith’s function in determining that gravitation is constant and in informing the fish of the conditions of its thermally stable deep-water habitat. The success of the species depends on the proper functioning of the otoliths. Histogram comparisons between species (Fig. 5) show that the mass range of Champ. gunnari otoliths is much smaller, being about one-fourth of the mass range of Ps. georgianus otoliths. This means that the mass of Champ. gunnari otoliths should be weighed 4 times more accurately to show the separation of age group ranges seen in Ps. georgianus (Fig. 5, Tables 1 and 2). However, similar linear equations (R2 = 96%, Fig. 5, Table 2) describing the increments of age group peaks in otolith mass histograms show their homogeneity with respect to fish age (Fig. 5). For the smaller species of Champ. gunnari, the overlapping age group ranges (Fig. 5) result from the low precision of otolith mass measurements (Fig. 5). In contrast to otolith mass, the lengths of the larger fish age groups have overlapping ranges, therefore non-homogeneity (Fig. 5, Tables 1 and 2), which results from maturation. The reason is increased generative growth involved in the production of sex cells at the cost of stopping somatic growth, with no further increase in length (Table 2, Figs. 1 and 5), 1, (Kock 1989b; Skeeles and Clark 2023).
Table 2.
Otolith shape. The age groups (A), total length (TL) & mature stage (ORLL>OH, OCL>OL, OCL>OH red numbers) by otolith morphometry for three species. Red numbers are when ORLL>OH, OCL>OL, OCL>OH - indicate first spawning Otolith mass. Icefish age groups in otolith mass with fitted linear their change to age data and with their appropriate total length at age. Champ. gunnari in 1978 and 1990. Ps. georgianus in 1979, 1990 and 1991. Chaen. aceratus in 1978 and 1990. [y] - age in years; N - sample number. OM, 10-3g - otolith mass. TL, cm - mean total length [cm]. The last column gives the statistics of the yearly growth equations shown in Fig. 5. p - parameters, ā - average, s - standard deviation, d - regression coefficients, C - intercept, R2- for the equations
The daily otolith growth measurements of 0.0024 mm in connection with an otolith radius of 0.55 mm give the number of daily increments over the 6-month age period for 6 cm TL larval fish (Figs. 2 and 3). Taken together with the above, the equal distances in following the age-group peaks in the otolith mass histograms (Fig. 5), show a linear annual increase in otolith mass peaks and corresponding mean lengths of 6, 18, 25, 33, 41, 47, 50 and 57 cm TL for age groups 0 to VIII of Champ. gunnari (Figs. 1 and 5). In the case of Ps. georgianus, the daily otolith growth (0.0028 mm) determines, as above, mean fish lengths of 8, 21, 35, 46, 51, 57 and 60 cm TL for age classes 0 to VI (Fig. 5). In the case of Chaen. aceratus, daily otolith increments (0.0016 mm) resulted in smaller peak values of otolith mass for age groups, and their mean lengths were 7, 18, 27, 34, 46, 55, 60, 62 and 66 cm TL for age groups 0–VIII (Fig. 5).
Icefish age, otolith, body shape and habitats differences
Approximately spherical, small otoliths, flattened on both sides (Fig. 6), change little with age in Champ. gunnari. A spherical shape is evolutionarily the best for an omnidirectional orientation and balance in the presence of shifting surface currents. The slender body of Champ. .gunnari (Fig. 7) is a further adaptation in support of a pelagic life in the warmer 10–250 m upper strong water currents (Fig. 8) confirmed by the occurrence of numerous species there, (Figs. 4 and 8). Champ. gunnari’s vertical migration to surface waters goes hand in hand with somewhat higher than longer otoliths, but after the fish mature, the increased growth of their colliculums leads to elongated otoliths (Fig. 6), that together with the largest among icefish flattening along the transverse plane, starts with the larvae (Fig. 6), lowers the horizontal resistance (in the direction of swimming to coastal spawning grounds) in the lymph surrounding the otolith and allows maintaining accurate balance and correct sound perception during fast swimming maneuvers. Meanwhile Ps. georgianus quite early in life, develops more massive and higher otoliths (Figs. 3, 5 and 6), as well as a heavier and higher body, which reduces vertical resistance in the wider vertical range between 150 and 500 m depth that it moves around and encounters eddies and swirls every day (Figs. 7, 8, 9, 10).
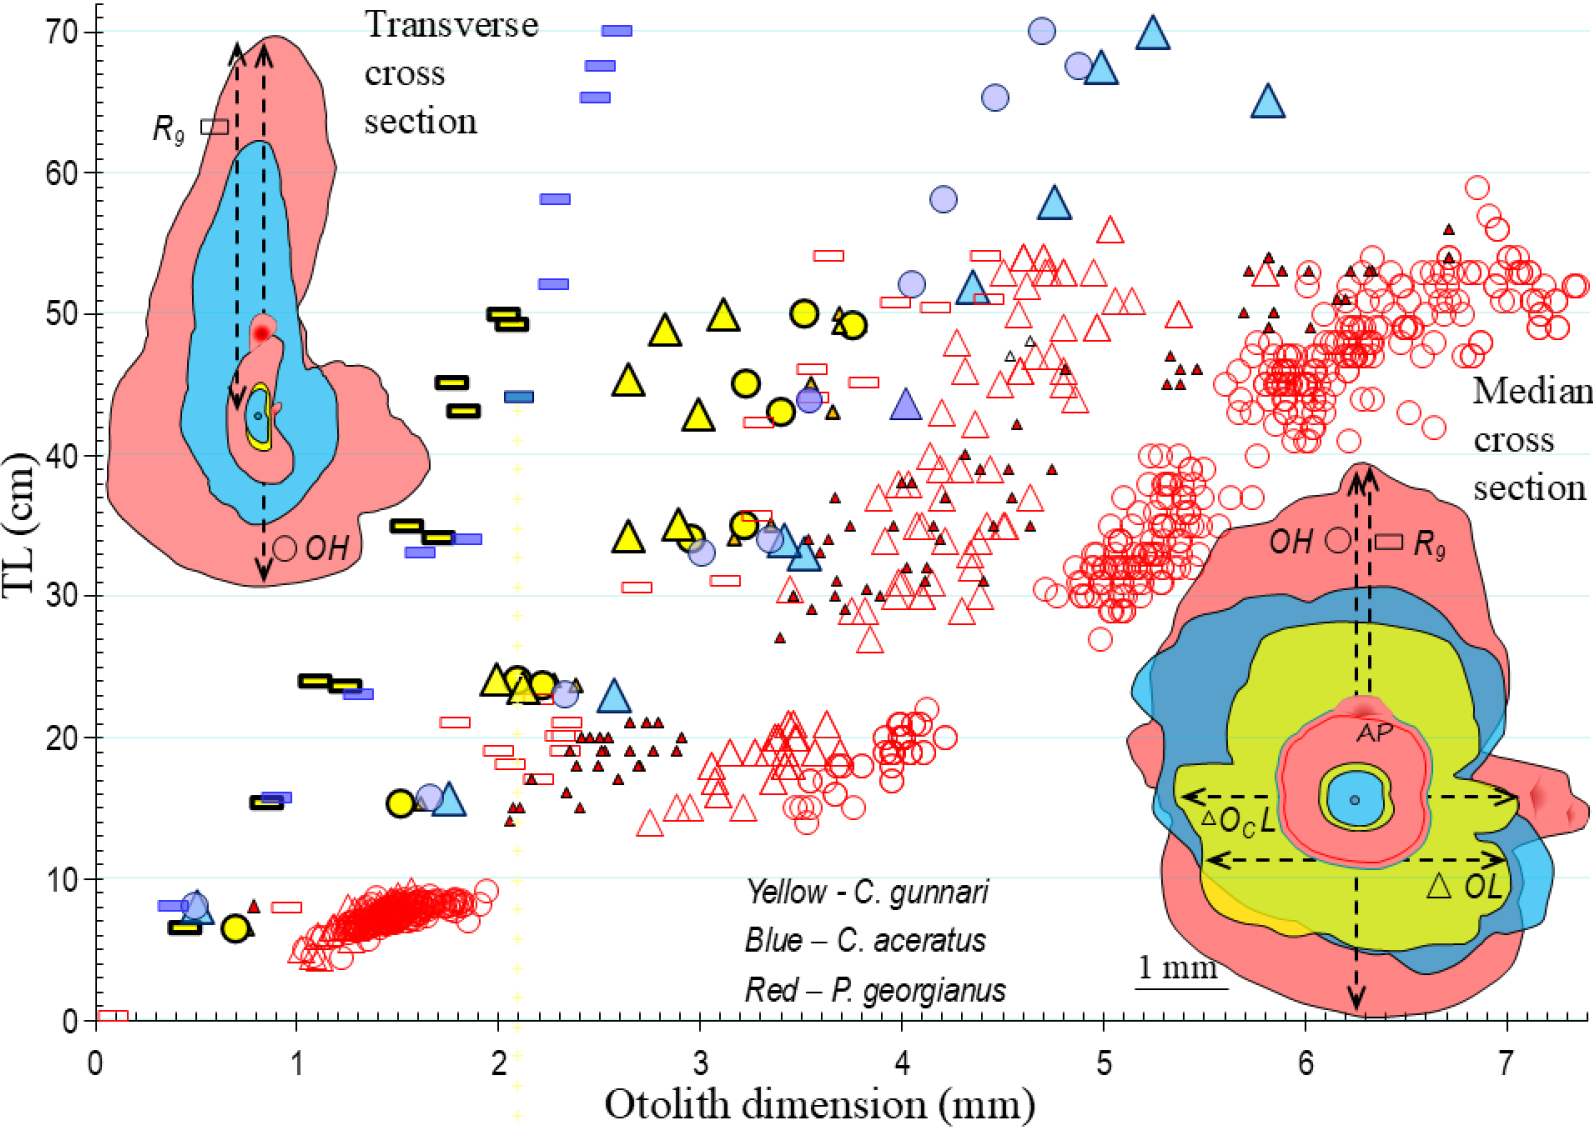
Fig. 6.
Age at development of otolith size and shape in December and January. OH, OL, OCL & ORLL - otolith height, otolith length: colliculum length and rostrum-dorsal lobe length - are natural markers of growth and maturity stage at age groups (close neighbors) of Champ. gunnari (yellow), Chaen. aceratus (blue) and Ps. georgianus (red). Contours on transverse and median cross otoliths sections show that development differences of age and maturity markers start from small, similar oval or circular otoliths of their 6.9, 7.9 and 8.2 cm TL larvae to different species-specific otolith sizes and shapes for similar sized adults: 50, 52 & 51 cm TL. Generally, they are pendulum-like in shape on transverse cross-section and in median view they are greater in height (excluding reverse for Chaen. aceratus) with ostio-caudal sulcus’ openings and with dorsal lobed margins. Contours identify that OH, OCL in Ps. georgianus, OCL in Champ. gunnari and ORLL in Chaen. aceratus growth is faster by yearly new AP (little red fans, generating more strongly curved and bent otolith element and convexity with small radius). AP - additional primordium - growth centers cause doubling the speed of the otolith growth from main center at change of environment. They turn from the larval round contour (characterizing floating) into circular, higher and elongated shapes that mirror the change from larval to adult strategies congruent with species differences: Champ. gunnari remains in surface waters (elongate OCL by new AP at colliculum), Ps. georgianus migrates down to deep waters and up (greater height of OH by dorsal AP) and Chaen. aceratus migrates permanently to the sea bottom (elongating ORLL rostrally with new dorsal lobe). As the larvae hatch (0.5 y before data collection) the succession of developmental annual stages defines their body lengths, otolith sizes and shapes. Age group 0 = undeveloped larvae-fry, age I = juvenile-immature, age II = maturing adults, III = spawning adults, IV = second time spawning, V = multi spawning
Chaen. aceratus has the largest body size among the three species (Figs. 6, 7 and 11) and in the adult stage feeds exclusively on benthic animals, Bilyk 2011), which indicates the benthic lifestyle of the species starts with the larvae (Fig. 8). Despite being the largest species, Chaen. aceratus has lighter otoliths than Ps. georgianus (Figs. 5 and 11, Table 2). They have less aragonite deposition which serves the lighter body, Fig. 11, which is less dense due to the reduction of bones and muscles. The lighter body uses less energy for swimming and for living in the cold benthic habitat, Żabrowski (2000). The fastest growth to adult stage (age group III) of the three species occurs in Ps. georgianus (Fig. 11), which occurs preferentially in colder, deeper waters (Figs. 9 and 10), but in the age group older than V, Chaen. aceratus outgrows the other species (Table 2, Fig. 11). Older individuals of this species, despite generative development, still maintain rapid somatic growth (Table 2, Fig. 11), deriving more energy from eating larger benthic animals. The other species continue to feed on krill. Ps. georgianus undertakes vertical feeding migrations to the upper zone at night, receiving krill activity (Fig. 9) and also feeds on krill concentrations created by eddies Fig. 10. In contrast, Champ. gunnari forms large concentrations feeding on krill schools in surface waters (Figs. 8 and 10).
In addition, although the sizes (total lengths) of the larvae of all three species are quite similar (6–8 cm), Ps. georgianus with larger jaws and bigger pelvic fins were sometimes found to be confused with the slender icefish larvae of Chaen. aceratus and Champ. gunnari; and similarly with the young (Fig. 7). However, those observations were in the catches, reflecting real habitats. The growth of species slows substantially from the age of adulthood when the species are reaching sexual maturity and shift energy to prepare individuals for spawning. Ps. georgianus reaches a maximum size of 60 cm and by rapid juvenile growth has the shortest lifespan (7.1 y) (Table 2 and 3, Fig. 11a). Chaen. aceratus larvae hatch a month later than Ps. georgianus (Table 3) and although their growth rates are also fast, they are slower than the earlier hatching species, as species spend time in warmer water - they have a longer period of pelagic life in warmer surface water. Later, as adults, Chaen. aceratus gradually migrate downward to deeper, colder water that indicates the preferred distribution of larvae and young (Fig. 8) but unlike the other species they migrate to the bottom permanently. They increase their body size, jaw, (Fig. 7) and swimming speed to consume larger fish and other bottom animals, richer in calories than krill, and this leads to an increased growth rate and the largest total body lengths amongst all icefishes (Fig. 11).
Table 3.
Icefish catches at South Georgia. The numbers and units [cm] in the three orange rows are mean total length (TL) of age groups: I, II... VIII (empty squares indicate that young Ps. georgianus grow faster than Champ. gunnari and Chaen. aceratus and older Chaen. aceratus grow faster than Champ. gunnari and Ps. georgianus). Egg diameter (violet rows), larval length at hatch (blue rows). Last column: range of total lengths of fish caught in the commercial fishery (including age group 0). Depths of commercial capture reflect depth occurrences of larva. (arrows indicate vertical migration between 150–400 m)
Chaen. aceratus reaches the largest average total length in age class VIII (76 cm) and lives longer (9.3 ys: Fig. 11a) than Champ. gunnari, especially regarding the females of the species (Tables 2 and 3). No Chaen. aceratus males older than age group V were collected. The Champ. gunnari are the latest to hatch in the warmer surface waters of spring as the ages of their juveniles suggest, (Fig. 2), a conclusion that receives support from the smallest size of the body and the smallest number increments in the nucleus of all three species (Tables 3 and 4). The adaptation of Champ. gunnari larvae to tolerate warmer water is confirmed by their most northerly geographic distribution, life in the upper warmer pelagic (Fig. 8) where their growth rate is the lowest of the three species. Their bodies are slim and streamlined (Fig. 7) and individuals may live for 8.5 y, attaining their largest total length in age class VIII (57 cm), which is earlier than Chaen. aceratus (Tables 2 and 3; Fig. 11a).
Table 4.
Size of otolith dorsal radius, (R9), larval nucleus, juvenile otoliths (age group 0) and width of daily increments (width) at age group, ā-average
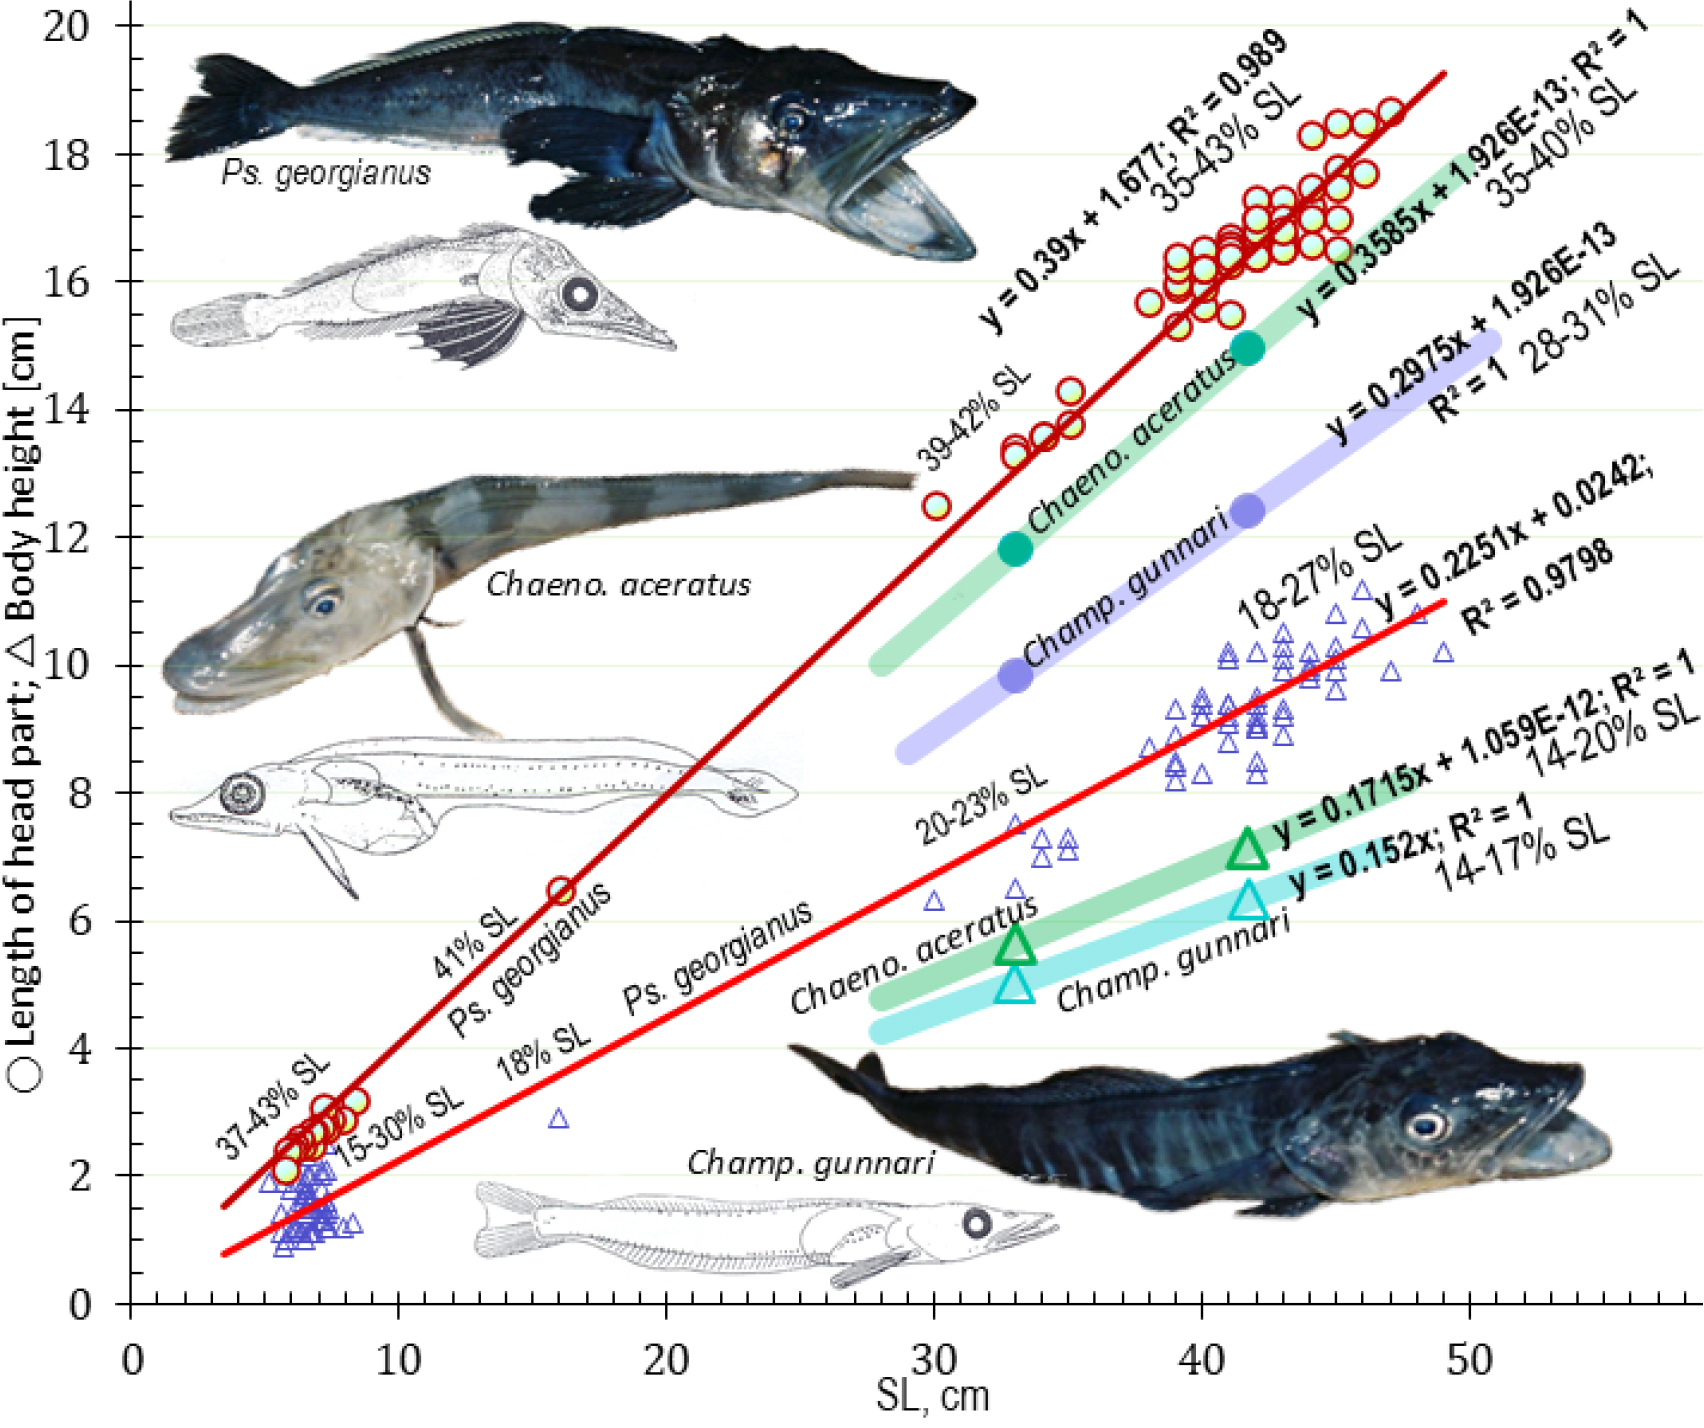
Fig. 7.
Age estimates from growth of the body shape parameters of icefish: O- length of head part and ∆- body height for body length with superimposed linear equations and its review by comparisons of species differences. There are 6 age groups Ps. georgianus in close members: 0: 7 (8), I: 16 (22), II: 30 (36), III: 40 (46), IV: 44 (50), V: 46 (52) cm SL (TL). Those revise the same linear mechanism in other large icefish - the simplest mechanism & resolutions are replayed by biology evolution (Szarski 1986). According to body proportions both body height (∆) and head part length (O) are largest in Ps. georgianus prove as otolith height, compact body shape, intermediate less height & compact in Chaen. aceratus and the smallest in Champ. gunnari prove as otolith most laterally flattened body shape. Drawing (top) of Ps. georgianus: 21 cm TL adult and larvae of 7.15 cm SL show stocky shape, that confirm small surface (S) to volume (V) ratio S·V⁻¹= 0.0762, which results in smaller energy losses through surface in the cold deep strong Weddell whirls (see Fig. 10 below). The drawing at the bottom depicts a Champ. gunnari adult, 15 cm TL, and larvae, 3.73 cm SL as most streamline, elongated shape that confirm large ratio of S·V⁻¹ = 0.138 indicate large energy loose that support fast swimming in strong surface warm circumpolar currents (Fig. 10). The middle figure shows a Chaen. aceratus adult of 16 cm TL and larvae of 2.1 cm SL with large head part but slim tail, that confirm middle but small ratio of S·V⁻¹ = 0.0898 indicate saving energy less than Ps. georgianus but much larger than Champ. gunnari so support a life in the cold, deep bottom but without current that much increase taking warms from body must struggle in whirls
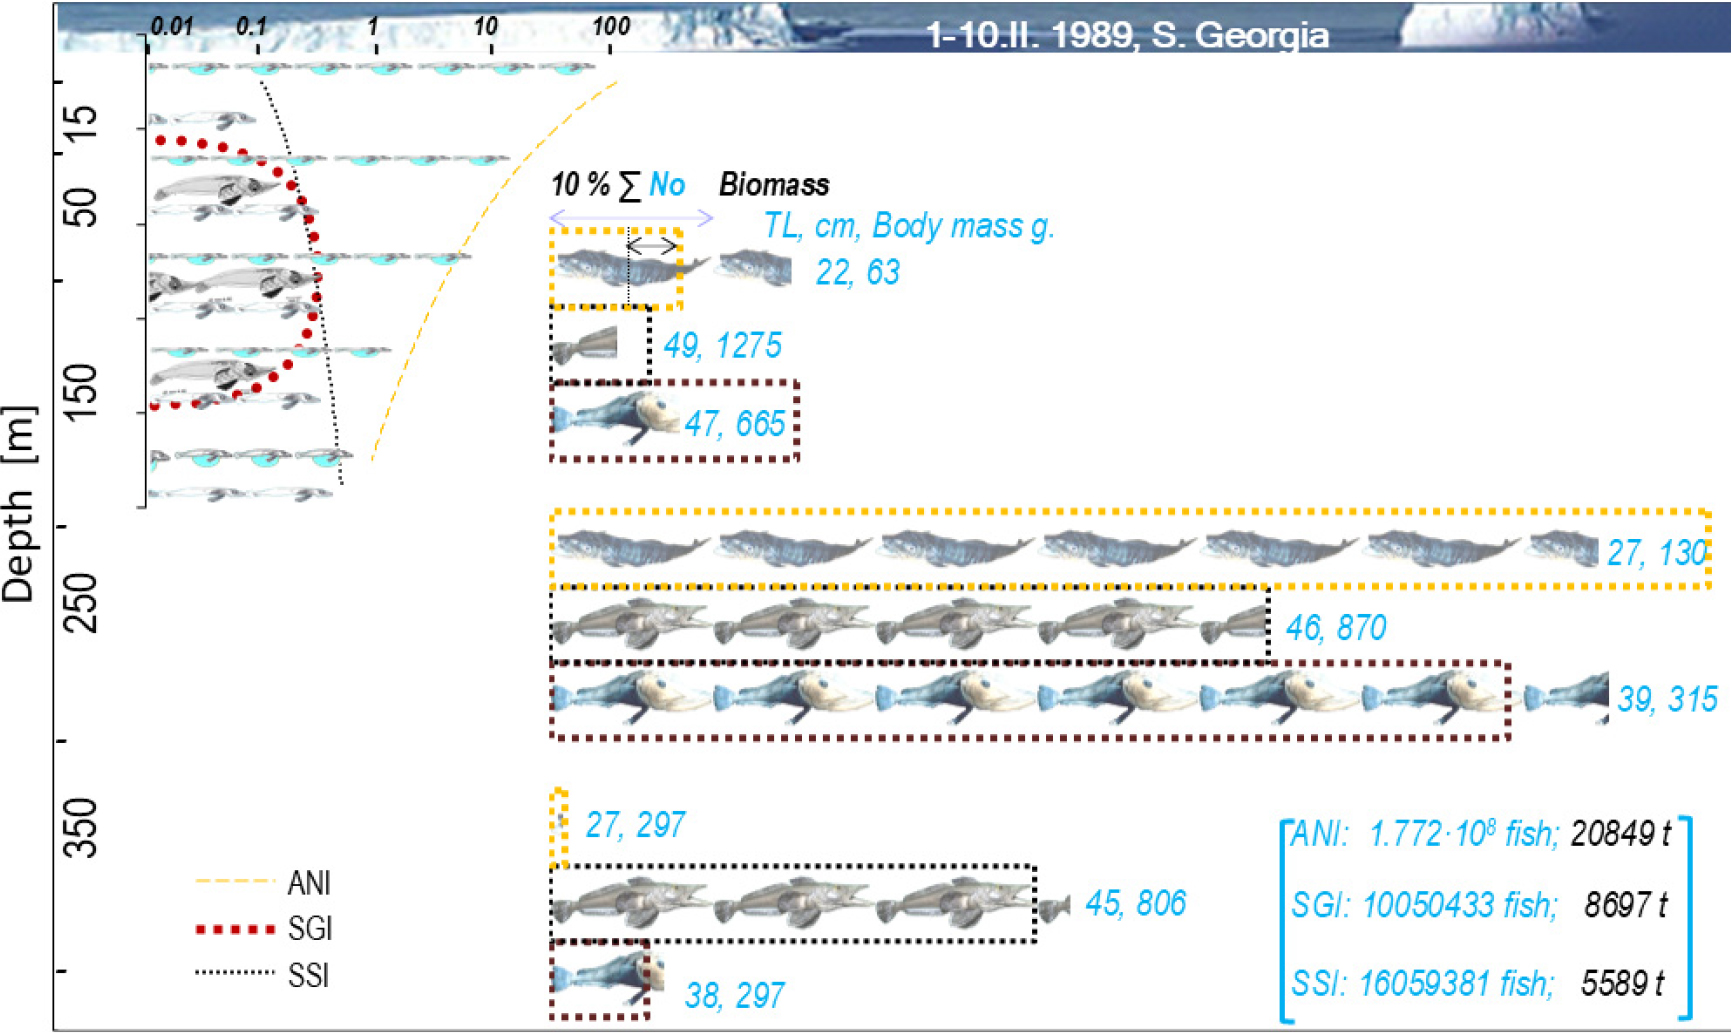
Fig. 8.
Age group vertical distributions are indicative of a species’ sequence in inshore spawning. In early and mid- February, mature Ps. georgianus of age group III, the largest at 50–150 m, dominate the inshore. Mature Chaen. aceratus in age group III redistribute outshore in deeper water at 250–350 m, indicating delayed migration to inshore for spawning. Inshore there are already larger and older Chaen. aceratus of age group IV, but they are not a food target for Ps. georgianus. Immature Champ. gunnari of age group II dominate in mid to late February, highlighting they are the last to arrive inshore for spawning. As a result hatched larvae, i.e. age group 0, distribute differently to maintain species coexistence without competing extensively for limited food resources. Larvae of Champ. gunnari (ANI) are most numerous in the 5–10 m warm surface water; they are also slimmer and smaller on account of their pelagic lifestyle. The number of Chaen. aceratus (SSI) larvae increases with depths up to 200 m, with elongated body shapes, similar to those of grenadier fish (fam. Macrouridae) known as rat-tails, like suggesting a bottom life strategy. Larvae Ps. georgianus (SGI) are most numerous at a depth of 100 m with their more stocky body indicative of a leading a semipelagic life. These three different larval spatial and thermally distinct habitats determine further age-dependent adaptations that become apparent by the different adult fish age group distributions
The otolith mass to body length relationship is greatest for Ps. georgianus, smaller for Chaen. aceratus, and smallest for Champ. gunnari (Fig. 11a). At the same length of 50 cm and age of 5 y, the first species has twice as heavy otoliths than the remaining two species, and this indicates an additional extra height advantage (Figs. 6, 7 and 9), which improves the accuracy of vertical feeding migration in eddies that concentrate adult krill (Fig. 10). The second species, Chaen. aceratus has a less high body, resembling that of some deep–water grenadier fishes, known as rat-tails (fam. Macrouridae), while otolith mass is reduced too with regard to its aragonite content. This is in agreement with the observed reductions of body mass, axial muscles and bone ossification, reflecting body shapes reminiscent of those of rat-tail fishes (Figs. 7 and 8). The third species, Champ. gunnari has squarish-round, small otoliths as a larva and adults (Figs. 6 and 7) and an elongated slim and thin body in accordance with Allan’s and Bergman’s Rules, (James 2018), to maintain their pelagic lifestyle in the warmer surface currents.
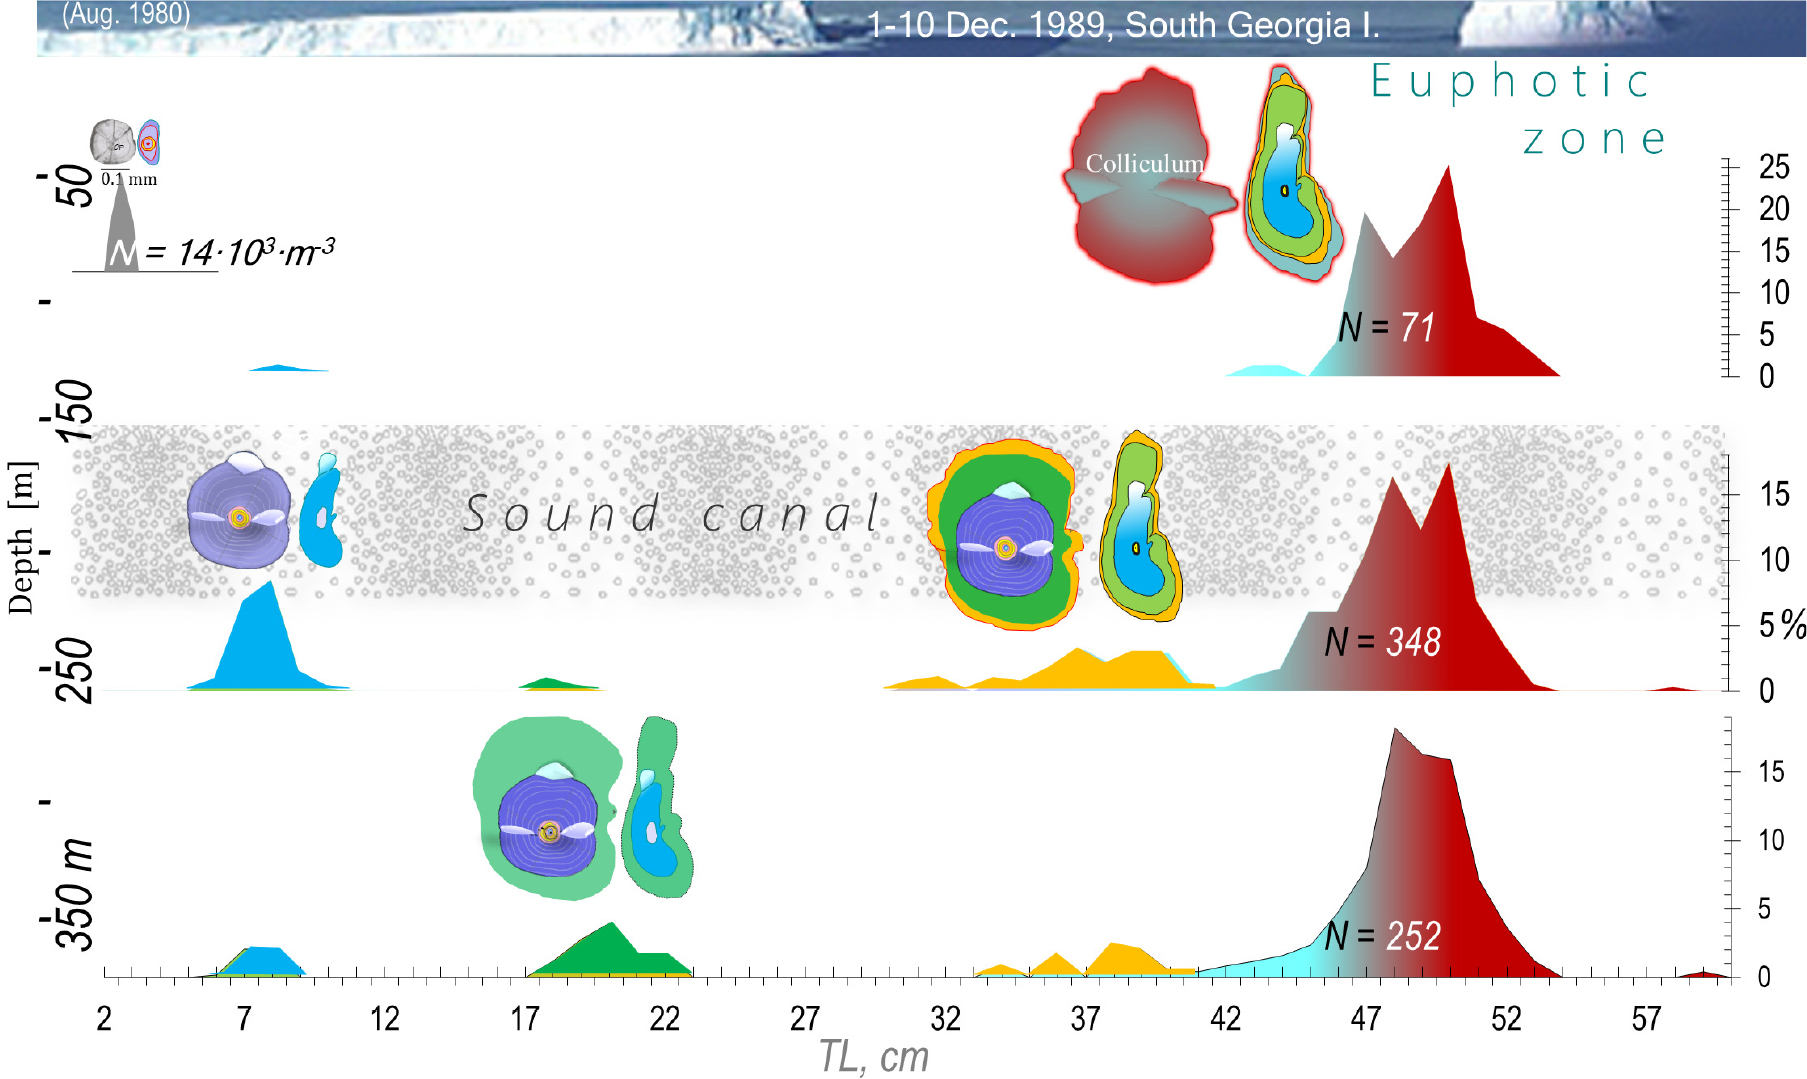
Fig. 9.
Vertical distributions or vertical habitat conditions determine age group markers in otolith morphology (such as AP). Age group 0 are 4 cm larvae of 50–150 m and 7 cm larvae of 150–250 m depths feed on krill larvae, whose early feeding migrations to deeper and colder water, crossing the sound canal, are reflected by the development of AP at the otolith’s dorsal edge. Age group I with 19 cm TL young immatures of 250–350 m feed on krill larvae occurring in deeper water further offshore (see Fig. 10 below). An AP’s doubling in size and heightening of OH indicates rapid somatic growth (OCL<OL). Older young of 37 cm TL, representing age group II at depths of 250–150 m, have returned closer to the surface following the upper distribution of larger krill larvae. OCL= OL indicates faster swimming in both sexes. Mature adults of age group III and approx. 47 cm TL at 50–150 m exhibit elongate collicula with edge OCL>OL data that are indicative of the balance changes the body undergoes when eggs are added to the body mass duringfor the fish’s first inshore spawning season. Age group IV, 50 cm TL, at 50–350 m depth, migrate from the bottom to the surface for feeding on adult krill. At night when krill migrate to deeper water, Ps. georgianus migrate vertically upward to feed on the krill. During the day, krill migrate back to the surface to feed on plankton while Ps. georgianus return to the bottom to rest, a scenario that is mirrored by the daily increments of the otoliths. Nomenclature as in Fig. 6
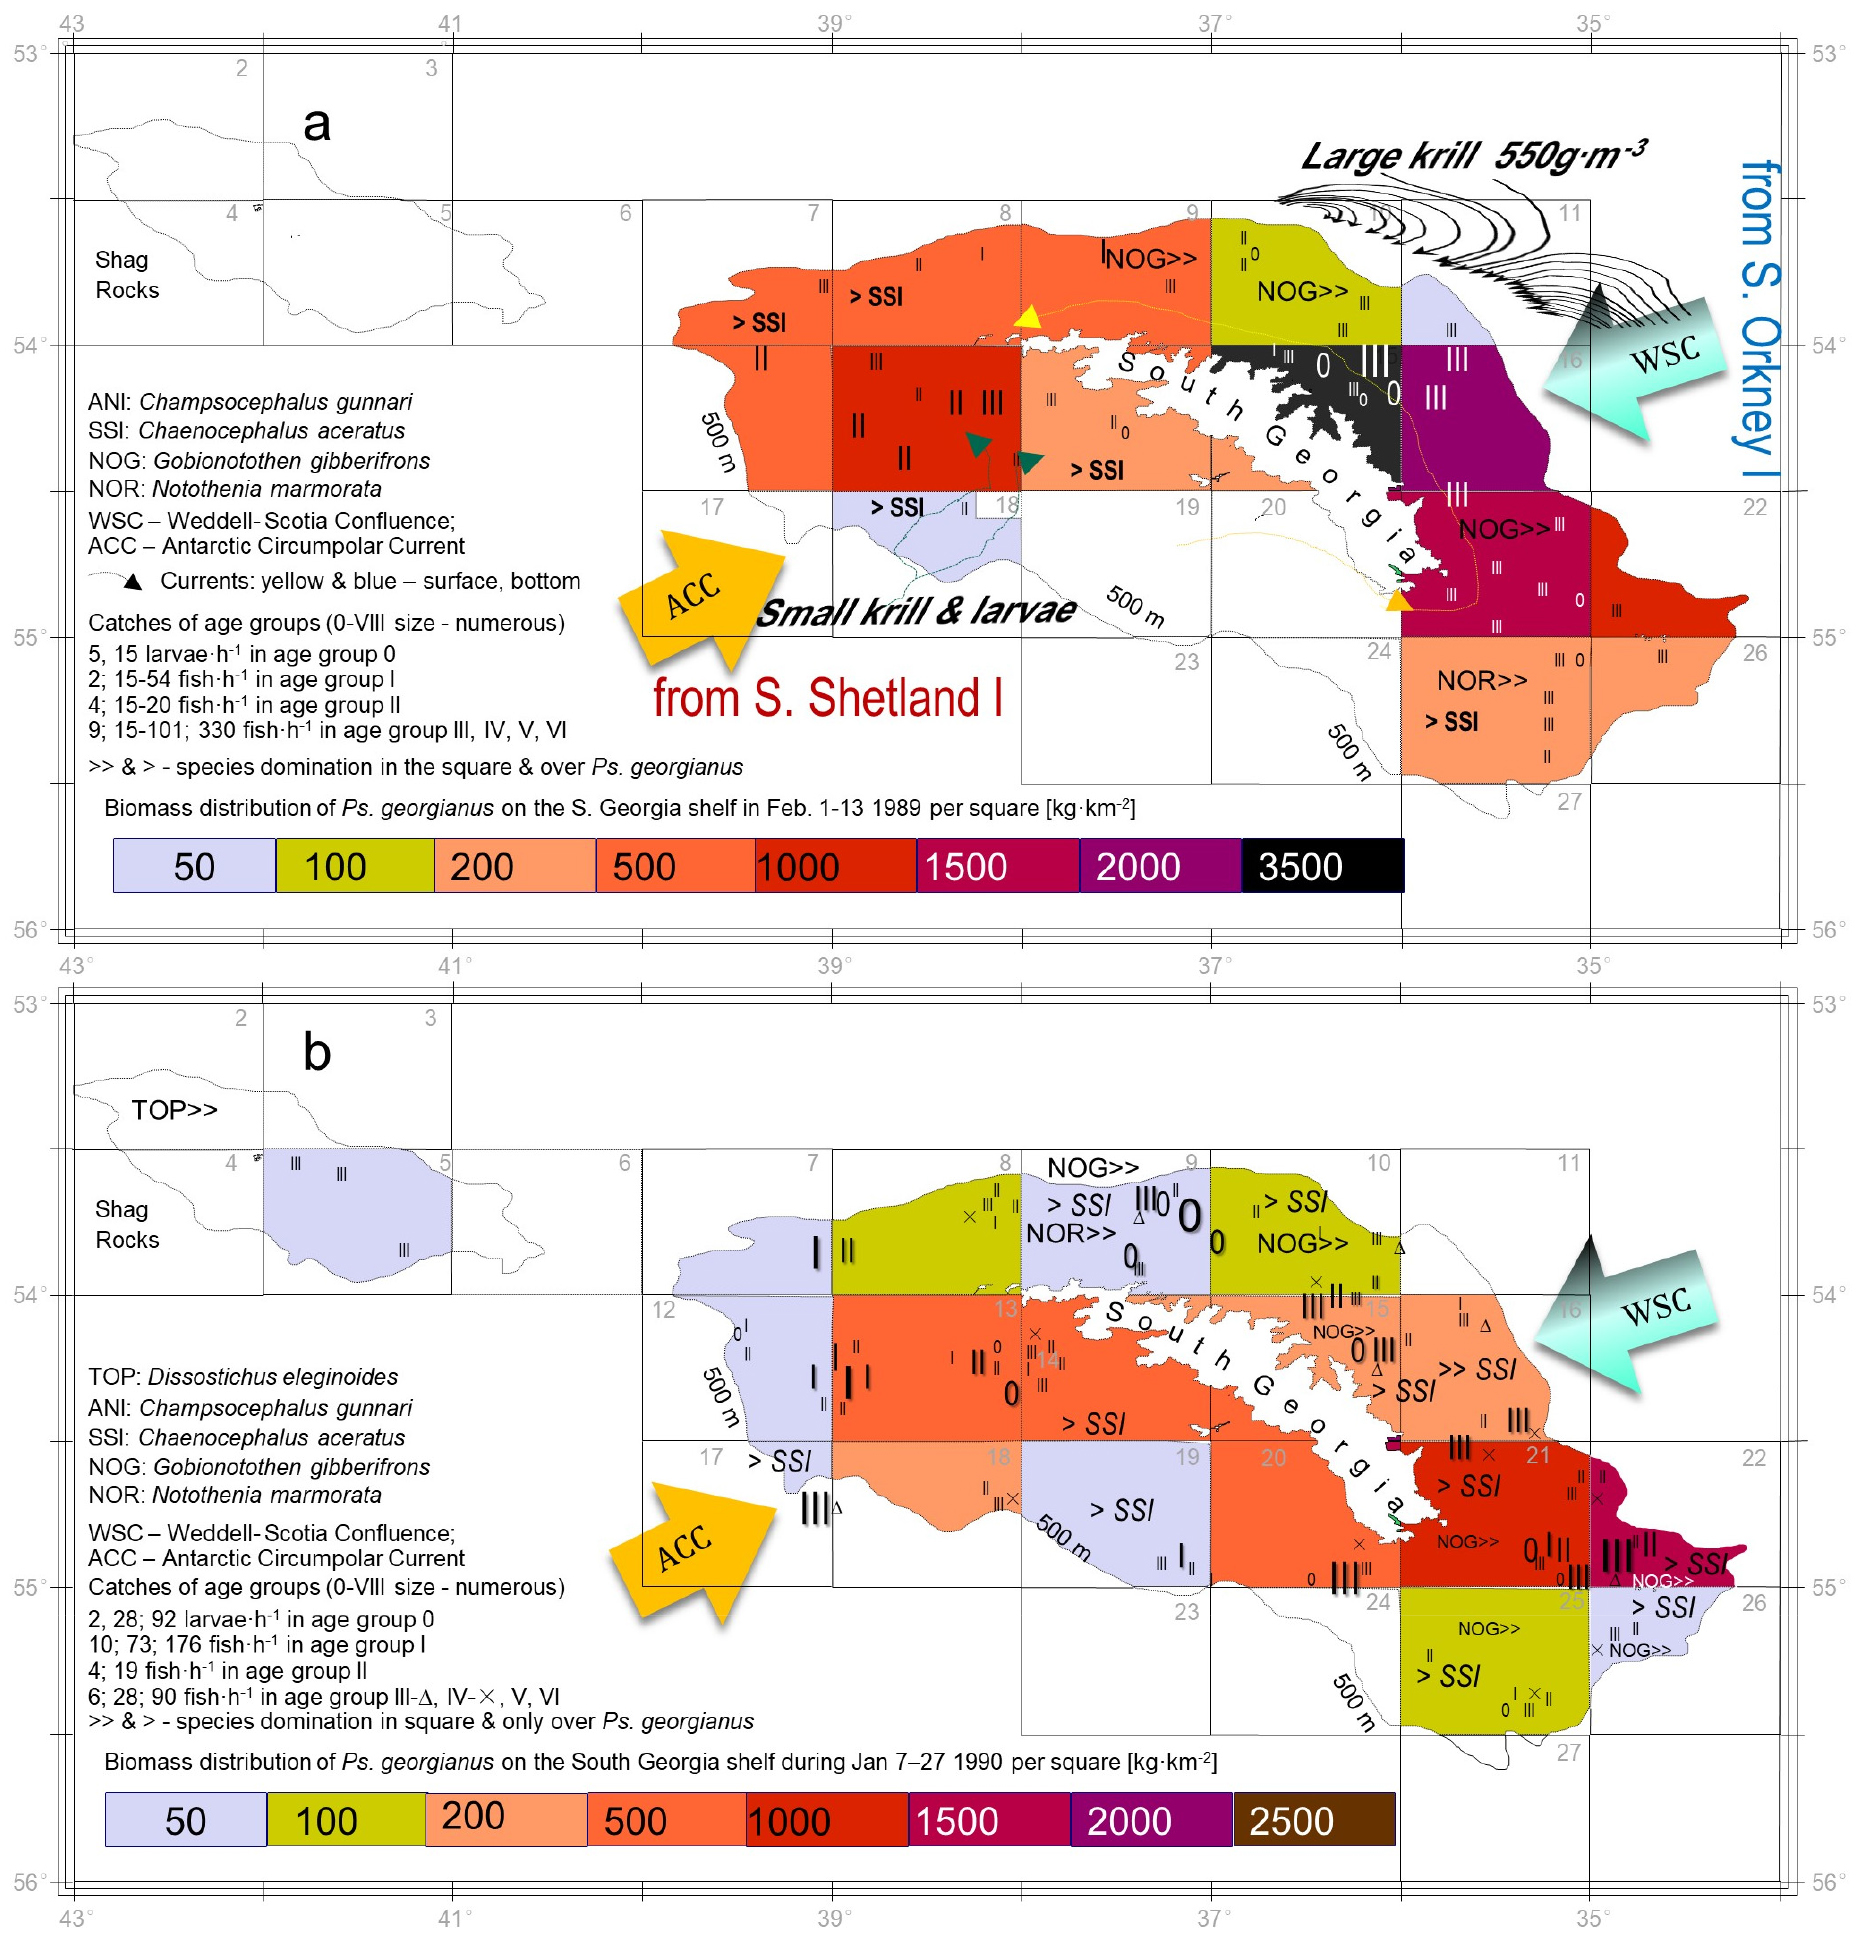
Fig. 10.
Age groups by geographic distribution around S. Georgia in regard to cold (a) and warm (b) seasons. In the cold season, large mature, Ps. georgianus in age groups III–VI+ aggregate on the northeast shelf in the cold surface swirls and currents of the Weddel Scotia Confluence (WSC) delivering large congregations of mature krill, which generate a high biomass. By contrast, young fish of age groups I and II aggregate on the southwest, feeding on small krill larvae delivered by the deep currents of the ACC. The young fish aggregations in this region are dominated by concurrent Chaen. aceratus and Champ. gunnari individuals. In warm years, however, species disperse around the island, with older age groups nearer the shelf edge. Chaen. aceratus aggregate around the north, while. Champ. gunnari forms pelagic concentrations to feed on pelagic krill swarms around S. Georgia. Where there is no >> sign, Champ. gunnari (ANI) dominates the entire statistical square. ACC - Antarctic Circumpolar Current
The total body length to body mass relationship (TL- BM) of the largest icefish, Chaen. aceratus, is the lowest (a large body saves energy and a low TL-BM is characteristic of a fleshy body with small density that allow optimal use of energy for moving a large, but small mass body, all in support of life in cold weak bottom currents), while that of the medium sized Ps. georgianus is the highest (indicating also saving energy in a body that is strong enough to tolerate cold water pressure during periods of life in cold strong swirls, Fig. 10). The smallest of the three species, Champ. gunnari, has the most elongated body with smallest head and body height, demonstrating that Champ. gunnari as the smallest species has higher energy losses (together with its high TL-BM and dense- muscular, elongated body both supporting life in strong and warm surface currents (Fig. 8 and 10)) than the other two species (Fig. 11b). A variety of factors in addition to food availability can, of course, affect growth differently of each species. For further explanations see the detailed legends to Fig. 7 and 11.
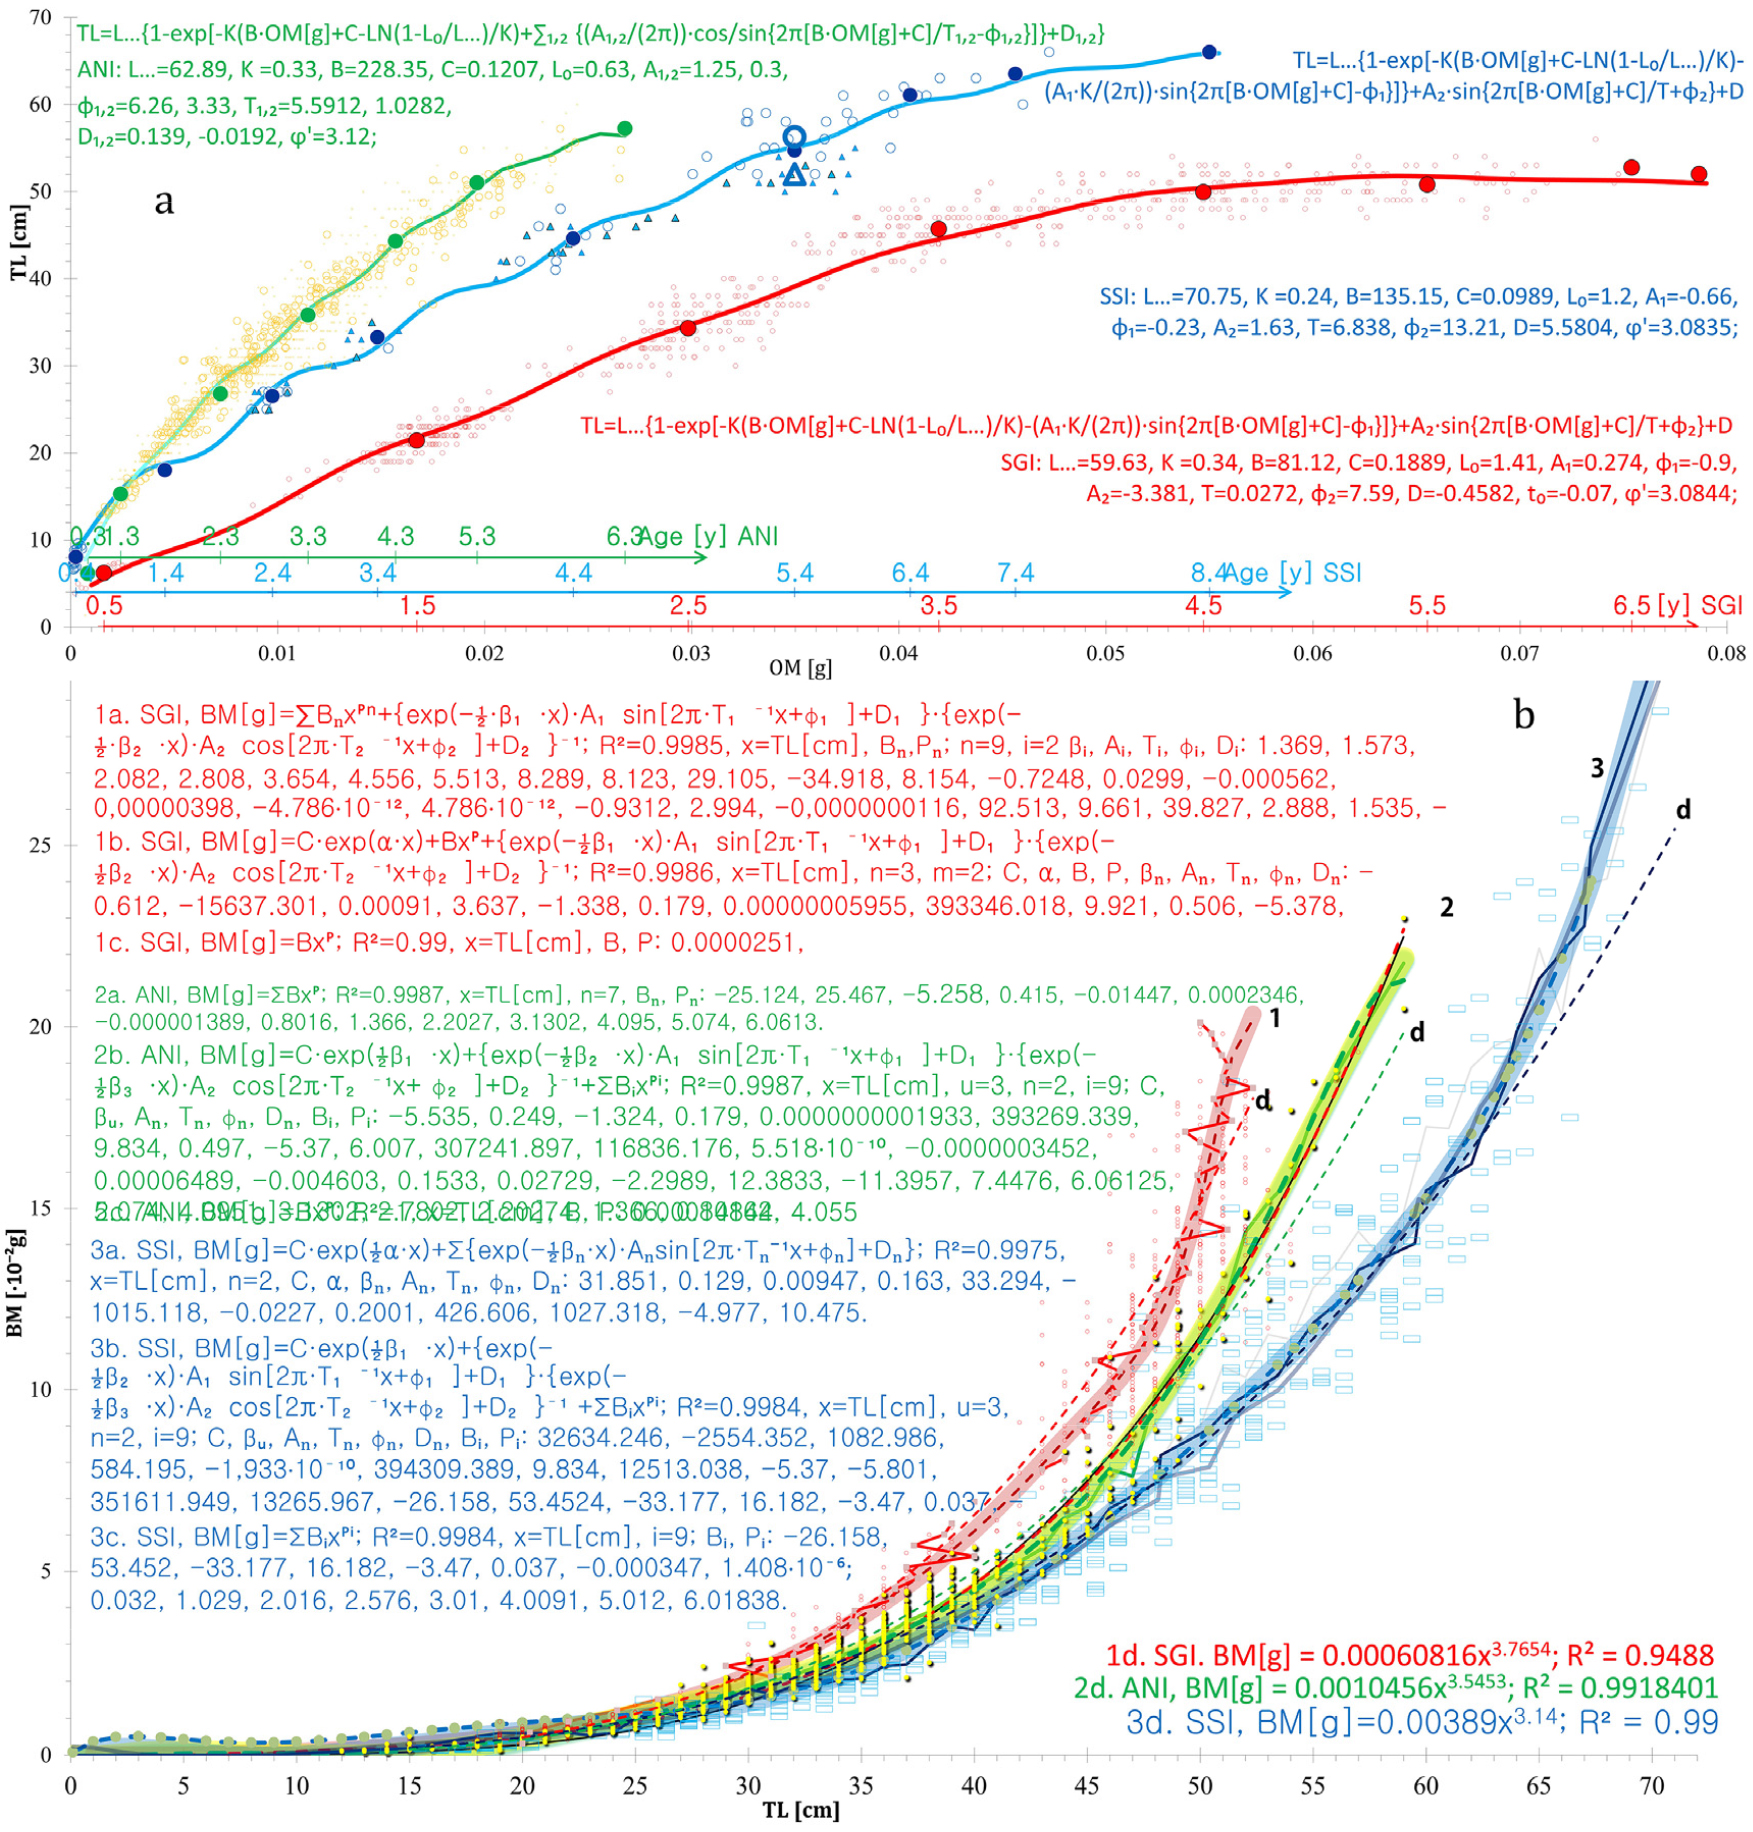
Fig. 11.
Comparison of total body length (TL), otolith mass (OM) and body mass (BM) at different ages, with fitted relationships for the three species (red = Ps. georgianus; green = Champ. gunnari; blue = Chaen. aceratus). (a) The Von Bertalanffy relationship, taking seasonal oscillations and integrated linear fish age [years] = d∙OM [gram] + C into account, shows three species of icefish fitting to warm, cold and intermediate water habitats at S. Georgia. Chaen. aceratus’ longer body (blue, SSI) saves energy. Their otoliths are half the weight of the 10 cm shorter Ps. georgianus (red, SGI), allowing the larger but lighter muscles and bones to use less energy in the cold, calm bottom water. The exceptionally large mass of Ps. georgianus otoliths balance greater body mass and a stockier body with a need to save energy for swimming in the cold, strong WSC currents and swirls (Fig. 10). Champ. gunnari (yellow-green, ANI) with the lightest otoliths, achieves balancing its bodies, even at comparable body lengths, by a more elongated, streamlined shape adapted to an increased heat exchange, advantageous for a life in the strong and warmer surface water of the ACC (from west–south, Fig. 10). (b) BM versus TL with data (points) and averages (broken lines) with power and combined equations fitted (curves), supporting the above outlined adaptations of the three species to different depth zones, current speeds and temperatures. The largest mass increases with increasing length in Ps. georgianus characterizes its stocky shape while the smallest mass increase combined with the largest length increase characterizes Chaen. aceratus and is indicative of body mass reduction. The mass growth rate in Champ. gunnari is smaller than that of larger Ps. georgianus but larger than that of Chaen. aceratus, showing no evidence of body mass reduction and being indicative of a slender, elongated, streamlined body
Icefish sexual differences
Size differences between different icefish species increase in prominence from the smallest Champ. gunnari to the largest species, Chaen. aceratus (Figs. 6 and 12, Table 5). Champ. gunnari showed no consistent sexual differences in body size. However, for the larger Ps. georgianus, females were generally 2-cm longer than males at an age when half of the individuals mature, whereas in the largest species of the three, Chaen. aceratus, females were 10-cm longer than their males when half of the individuals mature. A likely reason for this large difference is the lack of large size and older age group of males (Fig. 12), in this species.
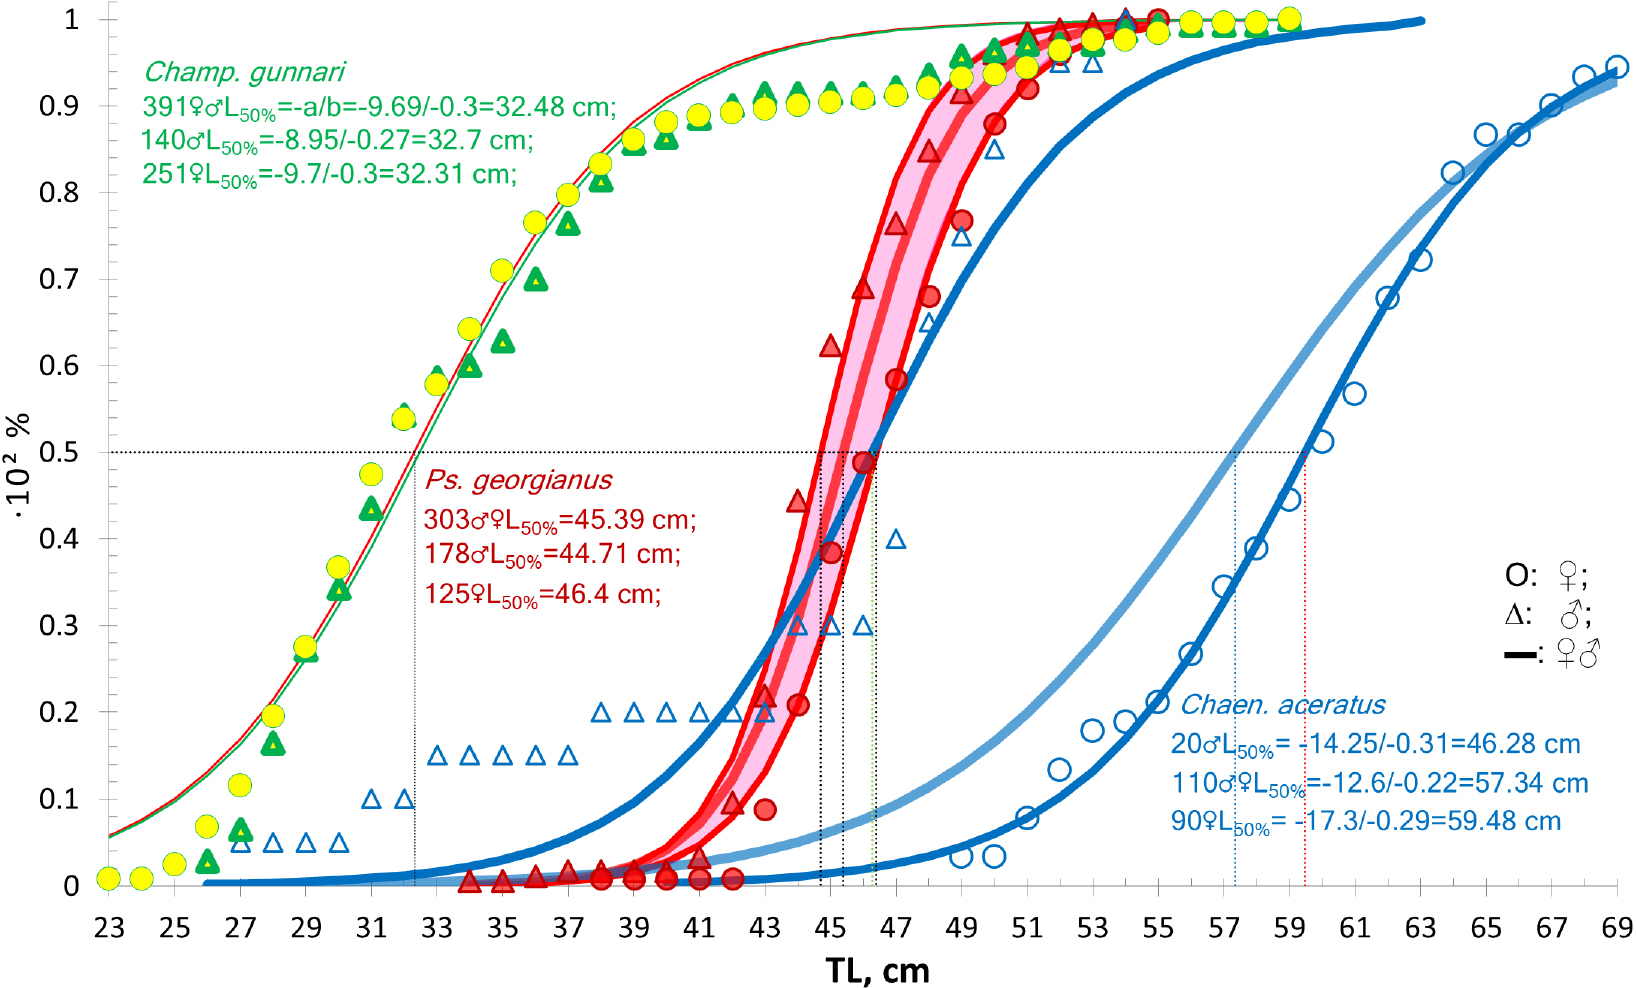
Fig. 12.
Three species of icefish adaptation to cold, warm and intermediate habitats of S. Georgia island by total length and age at first maturity, in 1991/92. The largest species are almost twice the size of the smallest at first maturity. That indicates their opposite habitats: cold for largest at then bottom, warm for smallest species near the surface. The middle size at first maturity of Ps. georgianus indicates their habitat between the smallest and largest species. Females, producing larger reproductive cells than males, need warmer water and are larger than males in cold water as seen with Chaen. aceratus, but smallest in Champ. gunnari occurring near the warmer surface. Triangles and circles indicate mature males and females, respectively. Curves are sigmoidal equations fitted to cumulative empirical data. Vertical dotted lines indicate the total lengths at which half of the individuals mature
Table 5.
Size, Total Length (TL50% cm) and age (A50%, y) of the first maturity of icefish by logistic equation fitted to empirical cumulative data; N - sample number. R2 - square of the Pearson’s correlation coefficient; Y - percentage of the number of specimens, TL - Total length class, Age - age groups in years, a and b - constant coefficients. X50% - the length or age at which 50% of the fish population achieved first sexual maturity. CG - Champ. gunnari, CA - Chaen. aceratus, PG - Ps. georgianus. Yellow - S. Shetland. 1a ♂, 1b ♀, 1c ♂♀, 2a ♂, 2b ♀, 2c ♂♀
| Males (X = TL, cm or Age, years) | Females (X = TL, cm or Age, years) | All (X = TL, cm & Age, years) | |||||||||||||||||||||
| A | b | X50% | R2 | N | a | b | X50% | R2 | N | A | b | X50% | R2 | N | Year | ||||||||
| CG | 8.62 | -0.26 | 32.9 | 0.981 | 146 | 9.51 | -0.29 | 32.25 | 0.989 | 262 | 9.42 | -0.29 | 32.52 | 0.989 | 408 | 1990 | |||||||
| Age | 5.89 | -1.6 | 3.68 | 0.992 | 463 | 1990 | |||||||||||||||||
| CG | 19.62 | -0.65 | 30.29 | 0.999 | 1343 | 10.9 | -0.33 | 32.83 | 0.997 | 376 | 16.6 | -0.54 | 30.7 | 0.999 | 1719 | 1975 | |||||||
| Age | 14.62 | -3.31 | 4.42 | 0.995 | 1343 | 7.4 | -1.49 | 4.97 | 0.991 | 376 | 13.47 | -3.02 | 4.46 | 0.992 | 1719 | 1975 | |||||||
| PG | 44.43 | 40 | 47.57 | 30 | 45.88 | 70 | 1979 | ||||||||||||||||
| PG | 49.8 | 41 | 50.74 | 29 | 50.12 | 70 | 1979 | ||||||||||||||||
| Age | 4.37 | 41 | 4.43 | 29 | 4.39 | 70 | 1979 | ||||||||||||||||
| PG | 29.03 | -0.65 | 44.71 | 0.994 | 178 | 25.87 | -0.56 | 46.4 | 0.994 | 125 | 26.39 | -0.58 | 45.39 | 0.995 | 303 | 1992 | |||||||
| Age | 5.744 | -1.791 | 3.21 | 0.99 | 178 | 6.921 | -2.1 | 3.3 | 0.996 | 125 | 6.219 | -1.91 | 3.25 | 0.994 | 303 | 1992 | |||||||
| 1CA | 37.64 | -0.74 | 50.6 | 0.984 | 26 | 32.68 | -0.53 | 61.51 | 0.992 | 29 | 12.93 | -0.23 | 56.22 | 0.971 | 55 | 1979 | |||||||
| Age | 10.17 | -2.153 | 4.72 | 0.994 | 21 | 16.86 | -2.99 | 5.64 | 0.999 | 24 | 11.851 | -2.27 | 5.23 | 0.999 | 45 | 1979 | |||||||
| 2CA | 46.28 | 20 | 59.48 | 90 | 57.34 | 110 | 1992 | ||||||||||||||||
| A. Champ. gunnari- published data. | |||||||||||||||||||||||
| No | TL50% cm | A50%, y | N | Year | m-th | Region | Data Source | ||||||||||||||||
| 1♂♀ | 23.68 | 1343 | 1975–9 | XII–I | S.Georgia | Sosiński 1990 | |||||||||||||||||
| 2a♂ | 27.87 | 246 | 1978 | I–II | S.Georgia | Kock 1980 | |||||||||||||||||
| 2b♀ | 23.33 | 284 | 1978 | I–II | S.Georgia. | Kock 1980 | |||||||||||||||||
| 3a♂ | 28.51 | 239 | 2013 | V | S.Georgia | Militelli et al. 2015 | |||||||||||||||||
| 3b♀ | 25.82 | 294 | 2013 | V | S.Georgia | Militelli et al. 2015 | |||||||||||||||||
| ♂♀ | 27.15 | 533 | 2013 | V | S.Georgia | Militelli et al. 2015 | |||||||||||||||||
| 5♂♀ | 37.72 | 2259 | 2009 | I | S.Orkney | Van Cise, 2009 | |||||||||||||||||
| ♂ | 23.5 | 3848 | 1976–93 | X–V | S.Georgia | Sosiński and Trella 2002 | |||||||||||||||||
| ♀ | 20.6 | 4120 | 1976–93 | X–V | S.Georgia | Sosiński and Trella 2002 | |||||||||||||||||
| ♂ | 35 | 1989 | S.Shetland | Kock et al. 2000 | |||||||||||||||||||
| ♀ | 37.5 | 1989 | S.Shetland | Kock et al. 2000 | |||||||||||||||||||
| B. Chaen. aceratus - published data | |||||||||||||||||||||||
| No | TL50% cm | A50% y | N | Year | m-th | Region | Data Source | ||||||||||||||||
| 3♂♀ | 51.0 | 2447 | 2009 | I | S.Orkney | Van Cise, 2009 | |||||||||||||||||
Co-occurring effects of fisheries exploitation and habitat conditions
Ocean conditions and fisheries exploitation have both affected the total lengths at maturity of icefish, summarized in Table 6. In 1979, average body size and age at maturity of both male and female Ps. georgianus were higher (49.7 to 50.7 cm total length) in S. Georgia (Fig. 13a) as a consequence of the cold Weddell Sea current and growth rate, than in the S. Shetland region (Fig. 13b), where the warmer South Antarctic Circumpolar Current led to earlier maturity at smaller body sizes (44.5 to 47.5 cm total length). A greater effect resulted from fisheries exploitation between 1975 and 1990–1992. For further explanations see the legends of Figs. 12, 13, 14.
Table 6.
Table of key life-history parameters at first maturity used in comparative parameters of growth equations for the three commercial species of icefish: ANI = Champ. gunnari; SGI = Ps. georgianus; SSI = Chaen. aceratus: L∞- asymptotic length at which total-length growth is zero, K - growth rate relative to L∞, i.e. how fast the fish reaches its maximum size, t0, L0 - age at which fish have zero size or length at the start of life, ϕ' - parameters that allow growth equation comparisons, Total Length (TL50% cm) and age (A50%, y) of icefish first maturity; a, b- coefficients of length and body mass relationships of ANI- Champ. gunnari, SGI - Ps. georgianus and SSI - Chaen. aceratus fish population at South Georgia Is
| Species | L∞ | K | t₀ | L₀ | ϕ' | L50% | A50% | a | b |
| ANI | 62.89 | 0.33 | 0.03 | 0.63 | 3.12 | 32.48 | 5.14 | 1.05 | 3.54 |
| SGI | 59.63 | 0.34 | 0.07 | 1.41 | 3.08 | 45.39 | 3.25 | 0.608 | 3.765 |
| SSI | 70.75 | 0.24 | 0.07 | 1.2 | 3.08 | 57.34 | 5.23 | 3.89 | 3.14 |
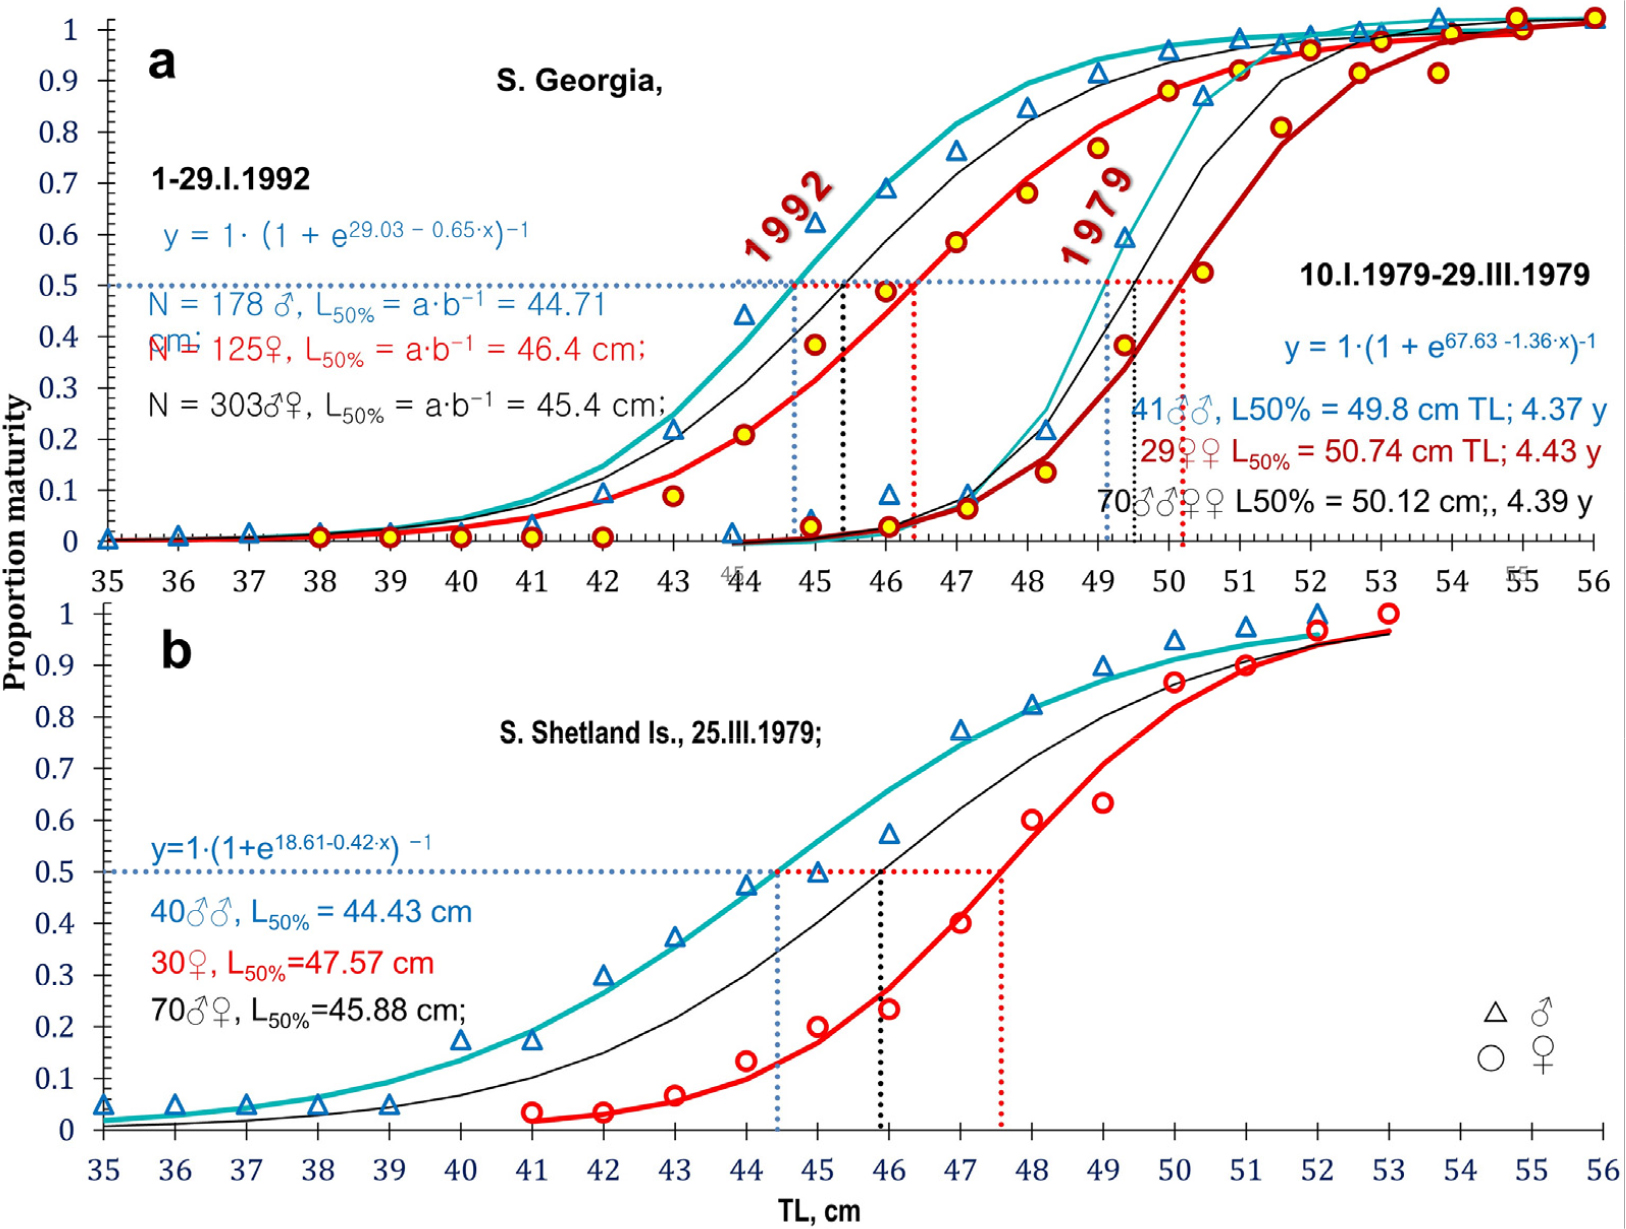
Fig. 13.
Size increase at maturity of both sexes during eastward direction from the warmer ACC at S. Shetland to the cold WSC at S. Georgia with a break of the deep-water temperature continuity. Total lengths at maturity of Ps. georgianus males (triangles) and females (circles) by logistic equation curves, fitted to empirical data at the beginning of the years of large icefish exploitation in 1979 from (a) subantarctic S. Georgia and (b) S. Shetland Islands. Vertical dotted lines indicate the total lengths at which half of the individuals mature
Extensive fishing efforts especially during the years 1975 to 1985 most likely can be held responsible for the observed changes in the body sizes of the three species. Age of maturity for Ps. georgianus at S. Georgia decreased significantly from a mean of 50 cm TL in 1979 to 45 cm in 1992, Figs. 12 and 13; for Chaen. aceratus a small increase from 56 cm in 1979 to 57 cm in 1992 was apparent, and for Champ. gunnari a major increase from a mean total length of 23.5 cm in 1975 to 32.5 cm in 1990 was noted (Fig. 14). These differences are likely associated with differences in species ecology related to a decrease or change in food supply driven by the warmer upper pelagic water as well as reduced krill populations as a likely response to global warming and the increasing commercial exploitation of krill.
Populations of Champ. gunnari also decreased majorly in numbers which could be a consequence of reduced intraspecies competition and lead to an increase in body size. One also needs to consider that larger individuals can avoid the warming effect of the upper waters and the threat of pelagic fishing, by selecting to stay in the deeper water layers which do not experience the same degree of warming and fishing. Furthermore, living at the sea bottom with its mountainous and far less accessible terrain for fishing nets be, has the advantage that it is largely avoided and bypassed in fishing operations. Additional explanations are: coastal under-ice spawning grounds, such as those in the Weddell Sea off Georgia, cannot easily recover for a number of reasons, of which a prolonged lack of ice coverage and pollution are the most severe.
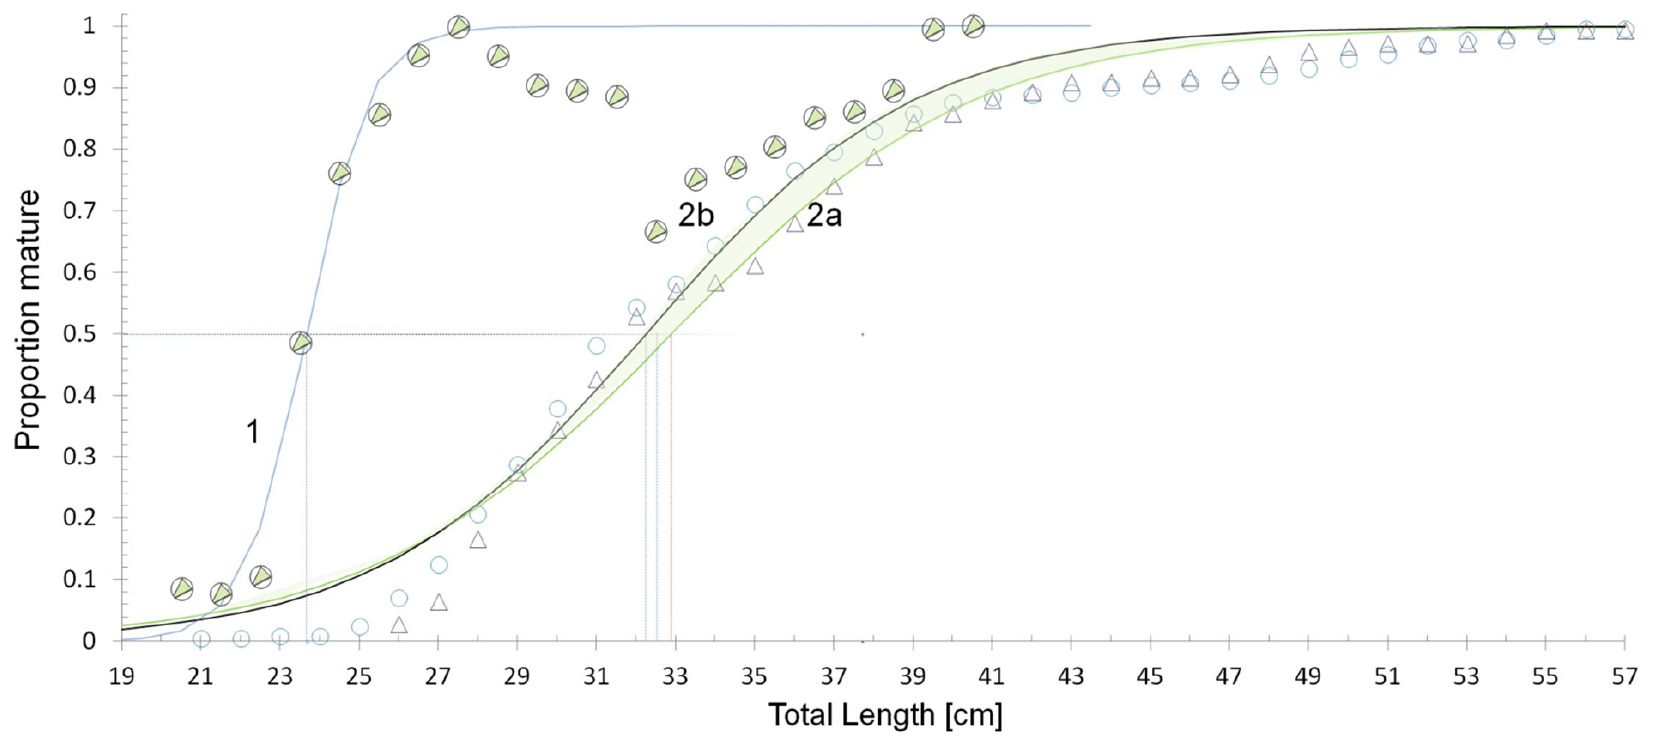
Fig. 14.
Size increase at maturity as a consequence of the change of the target area of the fish caught from focusing on the northeast (cold WSC) in 1975–9 to dispersed occurrence on all sides around of S. Georgia (dominated by the flow of warm ACC} in 1990, indicating separations of the distributions of the species’ maturity stages (i.e., age groups) by selecting different habitats. Total lengths at maturity of Champ. gunnari at the beginning of high exploitation in 1975–1979 (line 1 both sexes) focusing on the northeast and 1990 (line 2a, 2b) around S. Georgia. Triangles and circles are empirical data of total lengths of mature males and females, respectively. Curves are sigmoidal equations fitted to the empirical data. Vertical dotted lines indicate the total lengths at which half of the individuals mature
Sizes of Ps. georgianus individuals are known mostly from pelagic waters but species occurring at the bottom of the sea were not sampled. Larger Chaen. aceratus that change their habitat to permanently feed on benthic animal species only experience a smaller effect caused by a reduction of pelagic krill. However, the decrease in size of large males and females of Chaen. aceratus from respective lengths of 50 cm and 61 in 1975 to 46 cm and 59 in 1991 off South Georgia, Figs. 12 and 15, may be explained by accumulations of biological impairing contaminants at the bottom. The reported wide ranges between methods of estimations of length and age at first maturity indicate that blind age estimations from otoliths (reading otolith increments without knowledge of fish biology by few persons) in regard of age estimation may not be appropriate, Fig. 16.
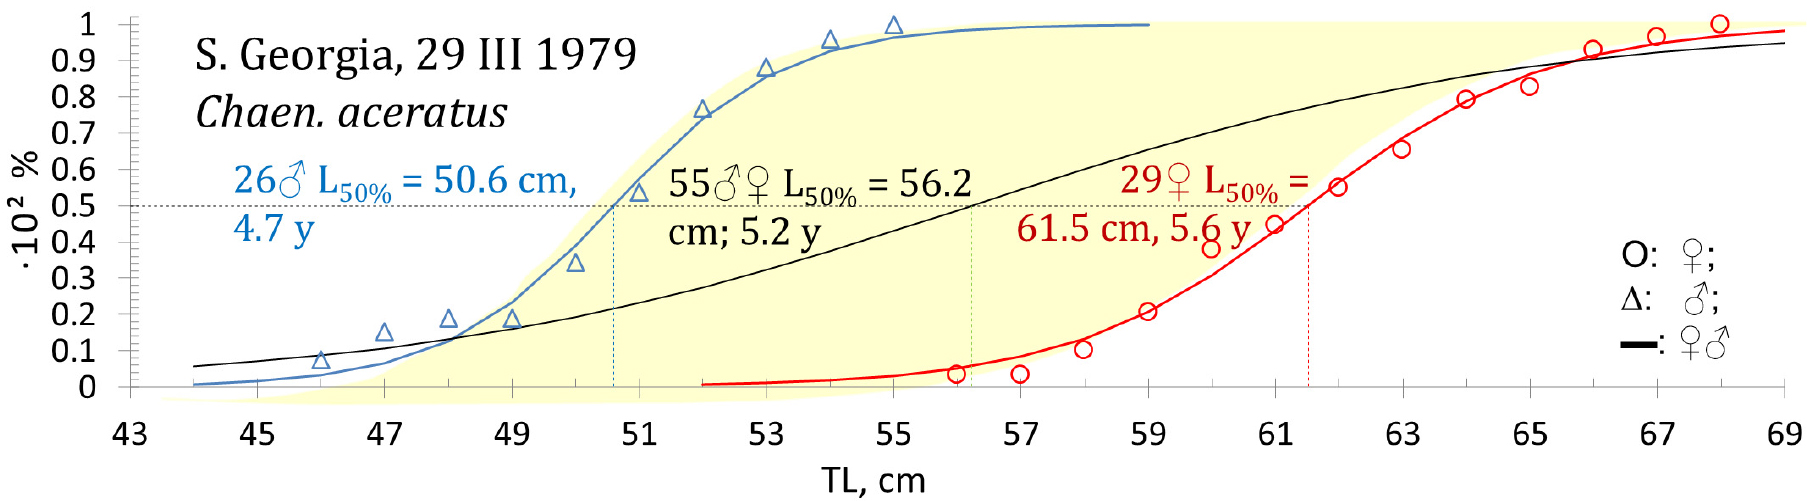
Fig. 15.
Size decreases at maturity from aggregated large adult to increased contribution of young, based on a change of the target area of fish caught from focusing on the northeast (cold WSC) in 1979 to a dispersed occurrence on all sides around of S. Georgia (warm ACC dominated) in 1992, indicating different habitat preferences s (separating aggregated large adults in the first and young in the second habitat). Total lengths at maturity of Chaen. aceratus at S. Georgia during the beginning of its exploitation in 1979 (A): Male, L50%, A50% = 50.6 cm, 4.72 y female = 61.5 cm, 5.64 y, both sex = 56.22 cm, 5.23 y and in 1992, at Fig. 12. The decrease of the size of males by 5 cm could have been caused by overexploitation. Triangles (1a) and circles (1b) and not marks (1c) are empirical data of mature males, females and their average (both sexes), respectively. Curves are sigmoidal equations fitted to the empirical data. Vertical dotted lines indicate the total lengths at which half of the individuals mature
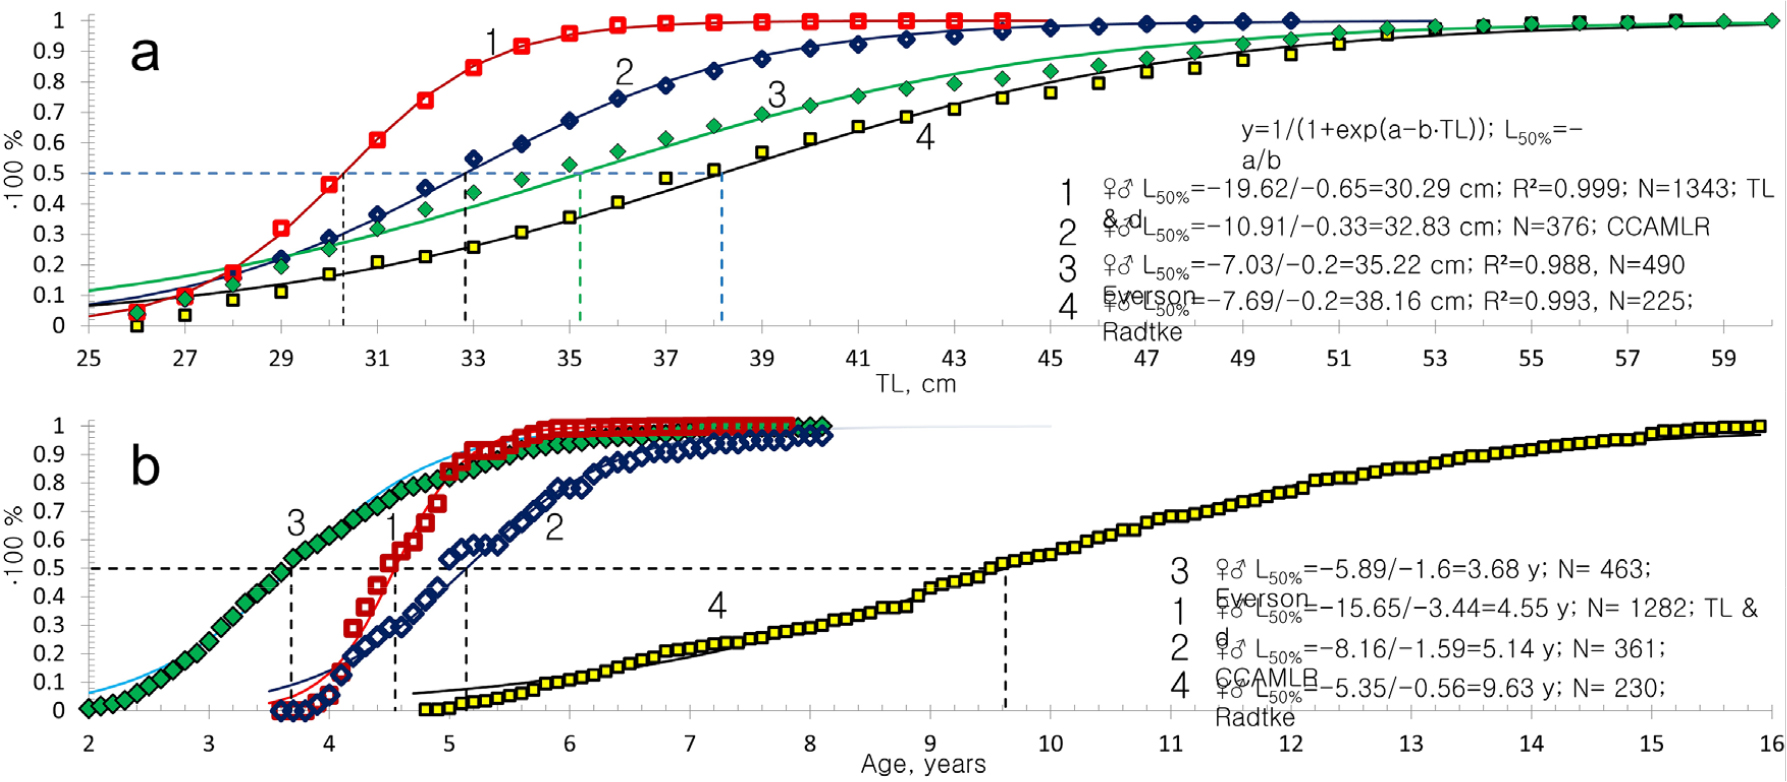
Fig. 16.
Different (a) lengths and (b) ages of first reproductive maturity of Champ. gunnari from S. Georgia obtained using different research methods: 1. based on automatic daily increment counts, 2. yearly cohort identification, generational growth during ontogeny, 3. yearly increment estimations of otoliths, 4. manual account of otoliths’ daily increments. The last method disagrees most with what was earlier published about icefish growth
4. Discussion
Age estimations
The basis for biological research and for predicting the response of icefish populations to changes in environmental conditions is to have a reliable method for fish age estimations based on otolith readings. Although the precise mechanism by which crystal formation and its maintenance in the otolith are achieved is still not fully understood and difficult to research (Lundberg et al. 2015; Schulz-Mirbach et al. 2019), it is believed that blind counting of otolith increments one by one with 3 to 5 repeats of the same sample to reach high conformity is the most objective and reliable approach. However, this process is time consuming and not always practical. Current scanning electron micrographs of the daily growth of fish otoliths are of fantastic quality, showing the form of aragonite needles in wide rings of daily growth, which, under higher magnification, reveal that they are alternating with narrow rings formed by collagen fibers (Radtke 1990). There is only one published age estimation based on daily increments of otoliths of adult Champ. gunnari icefish (Radtke 1990), but without any photographs it provides results inconsistent with the age groups created by the dominant peaks of closely related members in regard to the icefishes’ body lengths (Fig. 1) (Sosiński and Szlakowski 1992) and otolith mass (Fig. 5). They would represent natural and reliable indicators of the age groups in icefish (Gulland 1969; Hampton and Majkowski 1987; Basson et al. 1988). For example, Champ. gunnari individuals of the 13–17 cm fish group according to Radtke (1990) (Fig. 1), are 3 years old, and those of the next distant 21–23 cm size group, would be 5.5 years old. To have two different growth rates, one giving an age of 3 years and a second of 5 years, however, is impossible for icefish to have.
Impossibilities such as these are replicated further, for in the next group with body lengths 29–35 cm icefish are of the ages of 10.3 years; 38–44 cm icefish would then represent 11.7-year-old fish and the 49–55 cm icefish group should include 12 to 19 year old fish. Meanwhile, the yearly increases in lengths for all Champ. gunnari, Ps. georgianus and Chaen. aceratus are approximately 12–10 cm (our Fig 1 and 5; Jakubowski 1971). Considering that hatching of these icefish takes place only once a year therefore means, the first peak of icefish length, equal to 6 cm in January, should be 0.5 years old. It confirms data on hatching of 1.5 cm Champ. gunnari 5–6 months earlier in September, (Traczyk and Meyer-Rochow 2019) and the ranges of the next dominant peaks in icefish: 13 to 17 cm; 21–23 cm; 29–35 cm; 38–44 cm and 49–55 cm of icefishes at ages 1.5, 2.5, 3.5, 4.5 and 5.5+ years.
Radtke counted 24 h increments at higher magnification, and concluded that one wide and one narrow ring of an otolith corresponded to the minimum plus the maximum optical density in the cycle of daily increment rings. This may be half of the period of the 24-hour cycle, which would result in a doubling of the number of daily increments. Daily vertical migration is governed by a daily rhythm (Wiemsperger and Rapin 2011), which also controls the pattern of daily increments in otoliths. Meanwhile for Champ. gunnari two vertical migrations during a 24-hour period were recognized while in Ps. georgianus and Chaen. aceratus only one time was apparent (Fig. 4). In otoliths periodicity is difficult to recognize and to differentiate manually (Fig. 2). Apparently, the period of oscillation of the daily harmonic has a length from one maximum to another maximum. Using automatic finding and counting of the daily periods in the optical density record, the full period from maximum to maximum is processed, giving exact values of 24-hour periods and numbers of daily increments that are consistent with the annual increments between the dominant peaks. This confirms automatic testing of the smallest common micro increment of 0.00024 width and a number of daily increments of 178 in otoliths of 6.5 cm Champ. gunnari (Fig. 2) and the annual growth of otolith mass (Fig. 5).
Moreover, collagen fibers constituting the pattern of the network of daily increments in the otolith microstructure form this network by rhombuses (Wróblewski 1983) on the cross-sectional plane and, in three-dimensional space, of rhombohedra, of which the corners of the longer diagonal generate adjacent new daily increments. Hence, one daily increment is partially connected with two opposite neighboring increments, which makes it even more difficult to manually distinguish and estimate the number of daily increments on the curved median surface of the otolith (Fig. 17). When daily increment counts are based on the surface of a sagittal median (Radtke 1990), that is curved (Fig. 17), then they constitute a mixture of two eighbours’ daily layers and may double the counts of daily increments.
Because the number of daily increments depends on the increase of the mass of the otolith (Age = a∙(OM) +b), we need to consider the dependence of the age of the fish on the length of the icefish (TL) and length of the otoliths (OL). However, these parameters do not describe (like the mass of the otolith) the age of older, mature fish whose somatic growth of fish length slows down, reflected by the otolith’s dorsal radius of the otolith. This was recognized by Skeeles and Clark (2023) to also affect the shape of AP at the rostrum (ORL, SSI) and the otoliths colliculi (OCL, SGI) (Fig. 6). When the OH ceases to further increase in mature adult icefish, then OrL or OCL should be considered.
In terms of their functionality and purposes, otoliths transmit two currently known types of oscillations: one in which the entire otolith moves the hairs of the macular epithelial cells, and the other in which the components of the otolith’s microstructure (without the otolith physical moving) oscillate and affect the charge of the macular epithelial cells. Both signals are then sent via the eighth cranial nerve, often referred to as the vestibulocochlear nerve, to distinct regions of the brain’s medulla where further action may be initiated (Tomchik and Lu 2005). These actions are not restricted to fish but occur in all higher vertebrate levels including humans and are especially important in their development (Mitrinowicz- Modrzejewska 1963; Sheykholeslami and Kaga 2002; Jones at al. 2010).
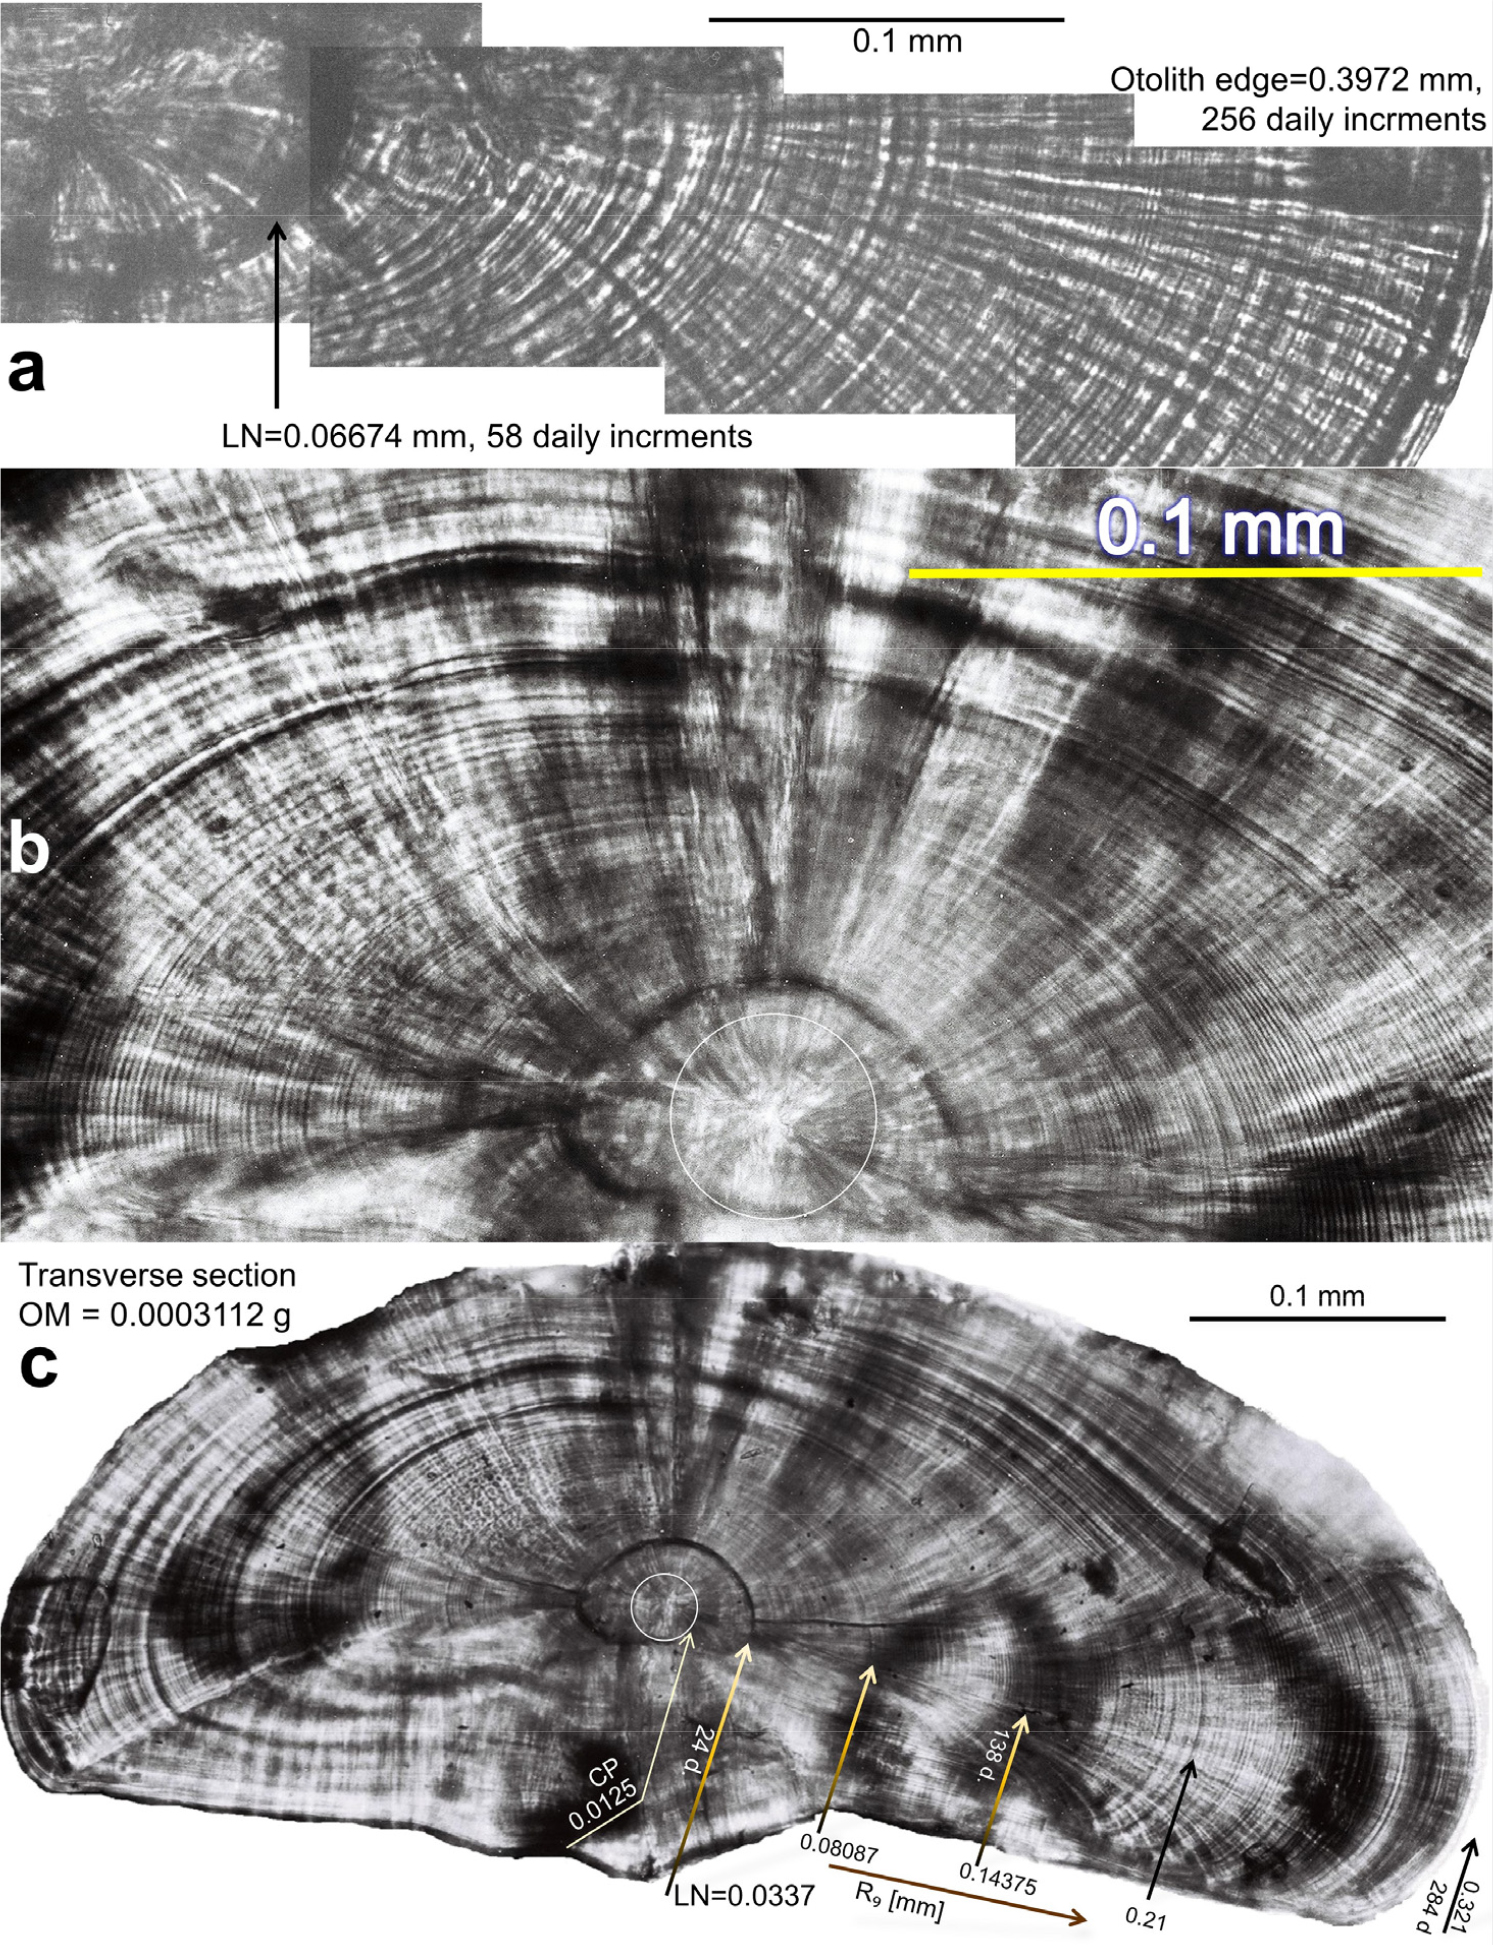
Fig. 17.
Difficulties in distinguishing and counting daily increments in larval otoliths. A - necessity to take a series of 4 shots and synchronize them for age of 0-year 7 cm post larvae = 256 daily increments. The number of shots increases 10-fold for otoliths of older 7 years 60 cm icefish. A fish of 7 years means 2,562 daily increments per two-millimeter otolith radius. Counting is performed under a microscope, with strong light through magnifying glasses penetrating the eyes for extensive periods of counting, leading to uncertain results and possibly temporary. Diplopia or presbyopia. One needs to read the numbers of daily increments of at least 100 otoliths and for the readings to be reliable, they must be repeated by three separate people in isolation, whose results must agree. B - To select readings in different parts of the otolith is necessary. C - Example of the transverse plane of a 3.112∙10-4 g left sagittal otolith of 7.6 cm SL juvenile of Chaen. aceratus from S. Georgia from catch No 62 (sample No 18) of January 1990. Note the central primordium of R9=0.0125 mm, 7 daily increments, Δ=0.00179 mm; a larval nucleus with a radius of R9=0.0337–0.048 mm, 24 daily increments with Δ=0.0015 mm and an otolith edge with radius 0.32125 mm, 284 daily increments and Δ=0.0016 mm. The transverse plane (T) increases the difficulty of correct age readings from daily growth along the median plane. Median inner sides have convex surfaces that could be missed on cross-sections through the centre and polished to a thickness of 0.005 mm have very close increments, combined and doubled with underlying tightly twisted increments
Life histories and distribution
A fish’s life history is closely linked to the fish’s age and growth. Age and growth data must agree with the information available on the location of the fish at different stages of its life and its bodily condition. The otolith nucleus as a marker of hatching is largest in Ps. georgianus, smaller for Chaen. aceratus, and smallest for Champ. gunnari. The 0.2-cm creepy Ps. georgianus larvae according to Efremenko (1983) and North (1990), hatch inshore during the cold midwinter (in July) at Cumberland Bay (CB) on the north-eastern side of subantarctic South Georgia. The area is cooled by the Weddell Sea and in November along the southern cold and ice covered regions of the Antarctic Palmer Archipelago closer to the icy continent (Sahrhage 1988; Traczyk et al. 2020). Differences in fish lengths and otolith mass between these two climatic zones indicate that hatching of Ps. georgianus occurs 2–3 months later in the Antarctic zone than on the South Georgia shelf. This species has the largest antifreeze activity (Bilyk 2011) and because of that, in their first summer, 7 cm TL Ps. georgianus rapidly migrate from inshore S. Georgia to cold deep waters (in December). There they feed on the early stages of E. superba along the south-western shelf of S. Georgia (Traczyk et al. 2020) and also from the Antarctic Palmer Base region to the cold deep water of the Bransfield Passage (BP) to the southeast offshore depths of King George Island, following the krill larvae (Sahrhage 1988; Traczyk et al. 2020).
Regarding older Ps. georgianus at the northern end of the Palmer Archipelago and South Shetland Island, where ice cover is extensive and small krill are found, the smaller and younger icefish dominate, (representing age groups II and III with peaks of 31 and 42 cm lengths), whereas further to the east on the South Orkney shelf with its large krill adults (Sahrhage 1988), only larger and older fish of age groups IV and V with respective lengths of 47 and 49 cm, are present (Traczyk and Meyer-Rochow 2019; 2022). Off the South Georgia shelf on the south–west sides where 20 and 33 cm age-group I and II Ps. georgianus occur, small krill from the Antarctic Peninsula aggregate, taken there by the warmer ACC. Older, larger Ps. georgianus, however, concentrate and migrate vertically in the vortices and eddies of the northeastern regions. That region contains assemblages of large krill from the South Orkney Islands taken there by the cold Weddell Sea swirls (Traczyk and Meyer-Rochow 2022). The biggest 6 y icefish congregate on the shelf edge in both zones where open oceanic krill is plentiful. In addition to the known vertical migrations (Traczyk and Meyer-Rochow 2022; North 1990) horizontal migrations at S. Georgia were emphasized by Mucha (1980), which means there is a single genetic population with identical growth rates and distribution of age groups. The islands of the Antarctic Peninsula can be assumed to be a single habitat (Mucha 1980; Traczyk and Meyer-Rochow 2019; Traczyk et al. 2020) connected by currents, underwater mountain ranges and rocks, corresponding to the habitat of South Georgia (Traczyk and Meyer-Rochow 2019; Traczyk et al. 2020).
The 1.5–2.1 cm long and slim Chaen. aceratus larvae hatch in the warmer late winter (as suggested by North 1990; Militelli et al. 2015) and possess less antifreeze (Bilyk 2011) so that they remain near the surface, prolongating development in the warmer currents of the pelagial. Larvae of approximately 7 cm TL, drift away from the shore to the north of South Georgia aided by the Antarctic Circumpolar Current (ACC) and to northeast from Elephant Island by the Bransfield Passage current (Traczyk et al. 2020). However, the larvae of this species congregate at somewhat deeper water (Fig. 8) and, growing older, then migrate slowly and gradually to water even of greater depths at the bottom, accompanied by an increase of antifreeze molecules, swimming speed and feeding on larger bottom animals (Bilyk 2011).
The 1.5 cm long and very slim Champ. gunnari larvae are the last to hatch (North and White 1987) in the relatively warm spring water and, having the lowest number of antifreeze proteins (Bilyk 2011), may even show adaptations to tolerate the warmer pelagic habitat (Corso et al. 2024). Their heart, for example, maintains its normal function and regularity even at elevated temperatures (Evans 2019). Because of these adaptations Champ. gunnari larvae aggregate close to the surface (Fig. 8) in currents that can transport the 6.5 cm TL larvae away from the shelves of S. Georgia by the ACC and the Antarctic Peninsula by BP currents. As this species, grows up, it remains in the warmer upper pelagic water, forming high density pelagic concentrations (Sosiński and Paciorkowski 1993) thereby increasing feeding success on pelagic schools of krill (Sahrhage 1988), especially when krill is rare in warm years (Canseco et al. 2024). Commercial catches indicate that Chaen. aceratus and Champ. gunnari were more numerous at 150–250 m, while Ps. georgianus were most abundant in deeper water of 150–500 m (Figs. 8 and 9) (Sosiński and Szlakowski 1992).
The knowledge of interspecies differences regarding their geographical and vertical distributions together with an understanding of their biology helps in verifying age estimates and growth rates for each icefish species. We may now predict icefish larvae of 0 y caught at the surface on the north–west, to belong mostly to Champ. gunnari while fewer are Chaen. aceratus. Larvae caught in the deeper water would be those of Ps. georgianus. Small, elongated adult icefish, appearing in large numbers near the surface, are mainly 2 and 3 y Champ. gunnari, while 1–2 y less numerous Ps. georgianus with a stockier body would occur in deeper water of the south and 1–2 y Chaen. aceratus would be found near the surface. Northern deep water with strong whirls and eddies would be the preferred habitat of 3–4 y Ps. georgianus, but in southern bottom water 4–5 y old Chaen. aceratus would dominate while the occasional presence of 4 y old Champ. gunnari could be expected to occur above the upper 250 m depth of water or not be present at all (Fig 8).
Cold and warm years
A thorough investigation of species interacting during environmental changes with oscillations of cold and warm periods in different geographic locations is of paramount importance if we wish to make predictions on the future of the interactions (Traczyk et al. 2020). Stable interspecies relationships can serve as an ecological buffer by affecting fertility as well as the size and growth parameters of the species. In cold years the dominant Ps. georgianus grows into large individuals and experiences a reproductive success, while in warmer years Chaen. aceratus and Champ. gunnari dominate and then reproduce more successfully than Ps. georgianus. Such cycles of domination replacement in time and space depend on temperature and allow developmental stages to adapt to different habitats, protecting them from competition for food and space (Fig. 10). Since warming of the oceans is not uniform, surface water warms up more and faster than the water of greater depths, and warming is also more common in the northwest but not on the east coast of S. Georgia and S. Shetland Island where the Weddell Sea inflow exerts a cooling effect (Fig. 10) (Traczyk et al. 2020).
The size of the larval otolith nucleus varies between warm and cold years and has an influence on the accuracy of exact age estimations. In past years with smaller ocean warming, Champ. gunnari as a species able to tolerate warmer water (Evans 2019; Corso et al. 2024), could mature rapidly to a smaller size adult (Fig. 14), redirecting energy from somatic growth into generative goals, which led to its great number amongst South Georgia icefish (Jakubowski 1971). During the warm 1990, Champ. gunnari had 10 cm longer bodies at first maturity than in later years (Table 5) and in the warm 2009 at South Orkney, when its ice cover completely disappeared, Champ. gunnari reached a size of 38 cm at first maturity (Table 5). In the colder 2013 y, this same species, however, had a significantly smaller size at first maturity (Table 5).
Additionally, warming of the upper water layers reduces krill populations (krill size decreases with temperature: y = -0.25T°C + 2.24) (Whitehouse et al. 2008), showing that the food chain can determine individual body sizes as well as population sizes of the krill’s icefish predators. During periods of krill shortages more salps appear (Atkinson at al., 2017), but being mostly food for squids, icefish do not favour them (Sahrhage 1988). Since climate change does not significantly warm up deeper water, it has a minimal direct effect on Ps. georgianus, except during times when they migrate upward to near the surface for spawning in inshore waters and also to consume krill. In 1979 at South Shetland when the water temperature rose due to influxes of warmer water from the Antarctic Circumpolar Current (ACC), young krill was smaller (Traczyk et al. 2020) and the lengths at first maturity and maximum sizes of Ps. georgianus were smaller, too (Fig. 13b). Maximally attainable body estimates under a global climate change scenario, were investigated by Pauly (2019b), who concluded that a warmer ocean would lead to shorter individuals and affect tropical fish most, because of the lower oxygen content in the warmer seawater. Meanwhile Ps. georgianus on the east side of South Georgia and at South Orkney where the water is usually cooled by swirls from the Weddell Sea, krill was bigger and Ps. georgianus feeding on it also grew to bigger individuals at first maturity and during its lifetime (Fig. 13a) (Traczyk et al. 2020). Later in the warm year of 1992, cold adapted Ps. georgianus (Bilyk 2011) had decreased by up to 5 cm in size at maturity (Traczyk and Meyer-Rochow 2019), but maximal sizes had not (Table 2), because this species migrates regularly to the cold sea bottom (Traczyk and Meyer-Rochow 2022) which is not warmed.
Warming has less of an effect on large Chaen. aceratus which lead a life permanently at the cold bottom that explains why its maximum body size is large (Fig. 15). However, in the warm year of 1992 young Chaen. aceratus with their longer development in the warmer upper water, had an about 2–4 cm smaller size at first maturity for males and females compared with the 1979 sizes (Figs. 12 and 15). The warm year of 2009 saw a complete elimination of the ice cover at South Orkney and the size of first maturity in Chaen. aceratus had decreased by about 6 cm, (Table 5). However, the maximal sizes of adult Chaen. aceratus of the cold sea bottom actually increased by about 5 cm, explainable by the ban on bottom catches of icefishes set up in 1990.
Awareness of the changes that affect otolith shapes and sizes , which are different for every species and linked to shifts of developmental stages that go hand in hand with habitat changes is important and helps to check age estimates (e.g., OH more precisely indicates age groups of young fish, while ORL, or OCL are superior in ageing older fish: Fig. 6). Different icefish length-mass ratios show that Champ. gunnari has a slim (fusiform) body, Ps. georgianus a stocky (short and more compressed) body, and Chaen. aceratus larvae and juveniles have slim bodies (Bilyk 2011) (Fig. 7). However, as Chaen. aceratus migrate to turn into bottom-feeding adults and their bodies deepen similar to those of Ps. georgianus, they retain relatively smaller otoliths and possess less body density because of bone and muscle reductions (Żabrowski 2000). The fusiform morphology of Champ. gunnari reduces water resistance, improves heat exchange and leads to faster swimming speed, all of which advantageous for swimming in strong pelagic surface currents (Fig. 10). Ps. georgianus has a hump-shaped body and higher otoliths with a greater mass, indicative of vertical up and down migration and few distributional changes throughout its life (Mucha 1980; Sosiński and Szlakowski 1992; Traczyk and Meyer-Rochow 2022). Chaen. aceratus has the largest body, but its relatively smaller otolith mass and body density (due to muscle and bone ossification reductions) in contrast to its very large pectoral fins are clear signs of a low-energy swimming strategy based on the use of pectoral fins in its benthic foraging lifestyle.
Icefish morphologies reflect an organism’s ecological niche and biological role, allowing species to be assigned to feeding guilds as Eskuche-Keith et al. (2025) have done it for Southern Ocean fishes (Parkes 1992), including Ps. georgianus, Chaen. aceratus, and Champ. gunneri. Seasons, however, also have an influence and individual body sizes and otolith shapes change from year to year and vary with the seasons as well as the status of sexual maturity and reproductive cycle. Inconsistencies such as these make it difficult to apply age groups analyses from previous, i.e., earlier to current years, which is why we recommend determining ages by focusing on dominant peaks with annual intervals taking into account otolith mass frequency to correct interspecies oscillations.
Fishery and ecology
Decreases in body length at different age classes of icefish between past cold years and more recent years at South Georgia are the consequence of changes of the growth characteristics (e.g., body mass may fall or increase in response to food availability and quality). Changes in krill availability for fishery (contrary to the icefish fishery) are driven primarily by fluctuations in the pack ice cover causing the krill’s pelagic dispersion by currents and to varying degrees being reflected in icefish species abundance and composition. Prior to 1975, during relatively high and widespread krill availability because of the extensive amount of ice coverage under which krill at that time could feed on ice algae safe from fishery, up to 13 km from the edge of the ice (Sahrhage 1988), Champ. gunnari were caught in large numbers with individuals growing up to 53 cm in length (fishing areas being only those of the northeast of S. Georgia and northwest of South Orkney with larger icefish of other species present (Sosiński and Paciorkowski 1993; Traczyk et al. 2020). Currently, with no ice cover, krill are less abundant and of a small size and as a consequence of that Champ. gunnari are small-bodied and restricted to pelagic patches, which is partly also the result of a ban to use bottom trawls (Kock et al. 1991; Frolkina 2001; Sahrhage 1988; Sosiński and Paciorkowski 1993). Likewise, Ps. georgianus, which prior to 1975 had specimens growing up to 57 cm and living longer than the smaller individuals caught nowadays. On the contrary, Chaen. aceratus (Le François et al. 2017) individuals continue to grow into large adults and reach a long life, because they live permanently at the colder depths of the sea bottom preying on larger animals there and being less dependent on krill.
Age estimations of icefish, based on otolith mass (Huxley 1932) and length frequency analyses (North 1990; Sosiński and Paciorkowski 1993; May et al. 1979) provide age-length data for stock periodicity changes between cold and warm years that allow predictions to be made on species requirements in regard to food under changing ecological conditions driven by climate change and periodicities. The periodicity between times and places of high and low density of Champ. gunnari may be linked to high and low catches of toothfish, e.g. Dissostichus eleginoides and their young shelf-dwelling stages’ food availability, or competition with adult icefish for prey. Knowledge of characteristic interspecies stock relationships (Szarski 1986; May et al. 1979) can provide greater reliability for the S. Georgia Island region (Sahrhage 1988) and should lead to better biomass estimates and predictions of a species’ stock, i.e., population structure (Traczyk and Meyer-Rochow 2019; 2020).
That such an approach is nowadays required has been announced repeatedly by CCAMLR over the years. Currently toothfish total catch and also that of Champ. gunnari has been decreasing. Fish from S. Georgia have decreased from 39,221–10,986 tonnes in 1977/78–2010/2011 to 1,979 tonnes in 2020/21 (including icefish from 10–2 thousand to 1–0.2 tonnes and toothfish from 10 thousand tonnes to 2 thousand tonnes: Appx. 1, CCAMLR 2024). Fishing of Champ. gunnari, however, focuses on the northwest of S. Georgia, a place of aggregation for small mackerel icefish with small krill support (CCAMLR 2022), was somewhat less affected and because of that, we need to transform earlier age-length structures and include the currently lacking data of older individuals in order to estimate more truly the biomass around the island (Traczyk and Meyer-Rochow 2019). Champ. gunnari ‘s biomass decreases because of being a prey species for fur seals, juvenile toothfish, gentoo penguins and other predators (Everson et al. 1999) (Appx. 2), of which especially Adélie penguins off the S. Orkney Islands are bad (Canseco et al. 2024). This biomass decrease may further grow and deepen by direct and indirect, natural and induced changes such as the warming of the world’s oceans. Should the warming persist or even increase, krill availability will undoubtedly further decrease. This would impact food chains (Appx. 2), and then affect all predators of krill, which would be forced to feed on the remaining fish, including icefish, while fishery efforts would have to dramatically increase in order to reach the amount of catch per unit effort six or more years earlier.
Catches of krill off the Antarctic Peninsula would decrease on account of fewer krill being transported to South Georgia by the ACC current (Sahrhage 1988; Traczyk et al. 2020). A decrease of food for young toothfish on the shelf determines the number of their adults on the continental slope, but without reliable stock assessments and age structures of icefish populations, there is no formal evaluation possible on the future impacts of climate change and environmental variability on krill, icefish and toothfish fishery. Currently the catches of icefish are known to have decreased enormously (see above) and those of toothfish are a quarter of what they used to be in comparison with respective maximum catches in 1983 and 2003. (SC-CCAMLR 2022, CCAMLR Sec. 2024) The impact of anthropogenic climate change is continuing to be felt (Aronson et al. 2011) and thought to have been the cause of the decrease in the area earlier covered by sea ice and by the resultant increase in area now accessible to commercial fishing. In fact, navigation and fishing resistance of Antarctic krill ships in floating ice areas were recently examined by Xiong et al. (2024), who concluded that proportionately trawl resistance increases with the vessel’s speed in contrast to ice resistance. However, whether this information to krill trawler operators will lead to a reduction in krill catches is doubtful.
Furthermore, foresight is required to understand that species interactions affect some species’ ecological roles and that stock is being modified with predator and prey species’ responding to alterations in food availability and evolutionary pressures to adapt to a different ecosystem increase. Lengths of icefish of all ages are smaller after warm summers (Traczyk et al. 2021; North 2005) and as the sea becomes warmer cold-adapted icefish become stressed but are not likely to become extinct. The distribution of Champ. esox in warmer South American waters shows that icefish may be able to adapt to warmer temperatures (Fisher and Hureau 1985; Evans et al. 2021), but as Corso et al. (2024) have shown for the channichthyid Neodraco skottsbergi there are differences between larval, juvenile and adult fish in their adaptability to warmer water and younger, less motile larvae may be especially susceptible to rapid warming events such as marine heatwaves. Reduced growth of icefish under warmer temperatures goes hand in hand with lower food needs and this generates shifts of organizational levels (Sahrhage 1988) and the timing of seasonal activity times (North 1991).
The recent discovery of a huge benthic spawning area in the Weddell Sea on the Antarctic shelf and the threat to its existence due to fishing activities, suggests that such unregulated activities in the past (some vessels dragging nets on the bottom rather than over the bottom, guided by greater profit) have destroyed similar large benthic spawning grounds on the northeastern S. Georgia shelf. Restoration and protection of the S. Georgia spawning ground must therefore be a priority.
Dioxins and plastics
Possibly an even larger threat than global warming comes from contaminants such as dioxins and the like as well as microplastics now increasingly present in Antarctica (Kobusińska et al. 2020; Gonzalez-Pleiter et al. 2021; Xie et al. 2022) and, close to Antarctic Stations, wastes and sewage discharges (Meyer-Rochow 1992, 1999; Smith and Riddle 2009). Otoliths of white-blooded fish, i.e. ice fishes, respond to such unwelcome additions to the sea water with changes of the otolith’s shape, appearance and chemical composition and can, therefore, be useful indicators of contaminants, including poisons and heavy metal ions, once they have entered the body through the gills, skin, or consumption of food (Safe et al. 1990).
In biological processes of self-organization involving the spatial arrangement of substrates, dioxins readily change structures (Brzeski 2011), i.e. they disturb the processes of self-organization. The sensitivity of icefish otoliths to dioxins is enhanced by their adaptation to live at temperatures below the freezing point of the water and by acquiring oxygen from diffusion through the skin, which then also allows dioxins to pass through, masquerading as oxygen. The pelagic, white-blooded Champ. gunnari have a 40 times higher concentration of pollutants than the pelagic red-blooded Gymnoscopelus nicholsi (Borghesi et al. 2009). Dioxins are small ring molecules with one to all hydrogen atoms replaced by electronegative halogens such as chlorine, bromine, iodine, fluorine in unmixed or mixed proportions. The altered otoliths are manifested by disturbances in the concentric growth pattern of the otolith’s microstructure (Traczyk and Meyer-Rochow 2022) and lead to a reduction in the acoustic perception of the environment (Campana 1999). Fish and animals living close to the Antarctic continent, and therefore close to stations inhabited by humans, show greater bioaccumulations of dioxins in the bodies of bottom-dwelling species than for pelagic species (Van den Brink et al. 2010). They also indicate the existence of higher pollution levels of habitats near Antarctic stations (Bargagli et al. 2005; Corsolini et al. 2002). The dioxins, unlike oxygen, accumulate in the bottom sediments, which is why benthic species, especially deep water icefish, experience greater destructive effects than semipelagic and pelagic species.
Some abnormalities were already observed of the otoliths of the icefish species Ps. georgianus, Chaen. aceratus, Chaen. wilsoni and Chionodraco hamatus (Traczyk and Meyer-Rochow 2022) even before 1989, but more recently abnormal otoliths with reductions in mass and distorted shapes (loss of edges, replacement of aragonite with lighter vaterite) have become more common. Meanwhile the collection of otoliths of white-blooded fish, published in 1987 and based on material from before 1987, does not mention any abnormal otoliths (Hecht 1987), but abnormal otoliths now feature in numerous publications (La Mesa et al. 2009; Holcomb et al. 2009; Reimer et al. 2016; Schulz-Mirbach et al. 2019; Traczyk and Meyer-Rochow 2022).
In Champ. gunnari there are deficiencies in the current layers of growth along the entire edges of the otoliths, which can be debris or a result of their dissolution, (Fig. 18). However, gaps in the otoliths’ growth not previously observed, must have begun to form in the recent past and have been reported from Champ. hamatus, Ps. georgianus (Traczyk and Meyer-Rochow 2022) and Champ. gunnari (Fig. 18). Observations such as these may indicate a change in the life strategy prompted by differences in habitat characteristics possibly caused by climate change, global warming, pollutants or combinations of a variety of factors. An increasingly higher dorsal part (Fig. 18) is indicative of vertical migrations to and from cold deeper bottom waters, whereas an increasing ventral part points to an increase in swimming speed. These changes (with substitutions of aragonite for vaterite) may be related to the reported changes in the reduction of ossification, culminating in significant bone deficiency, which may then lead to a reduction in acoustic sensitivity due to the absence or modification of echo-eliminating bone conductivity (Mitrinowicz-Modrzejewska 1963).
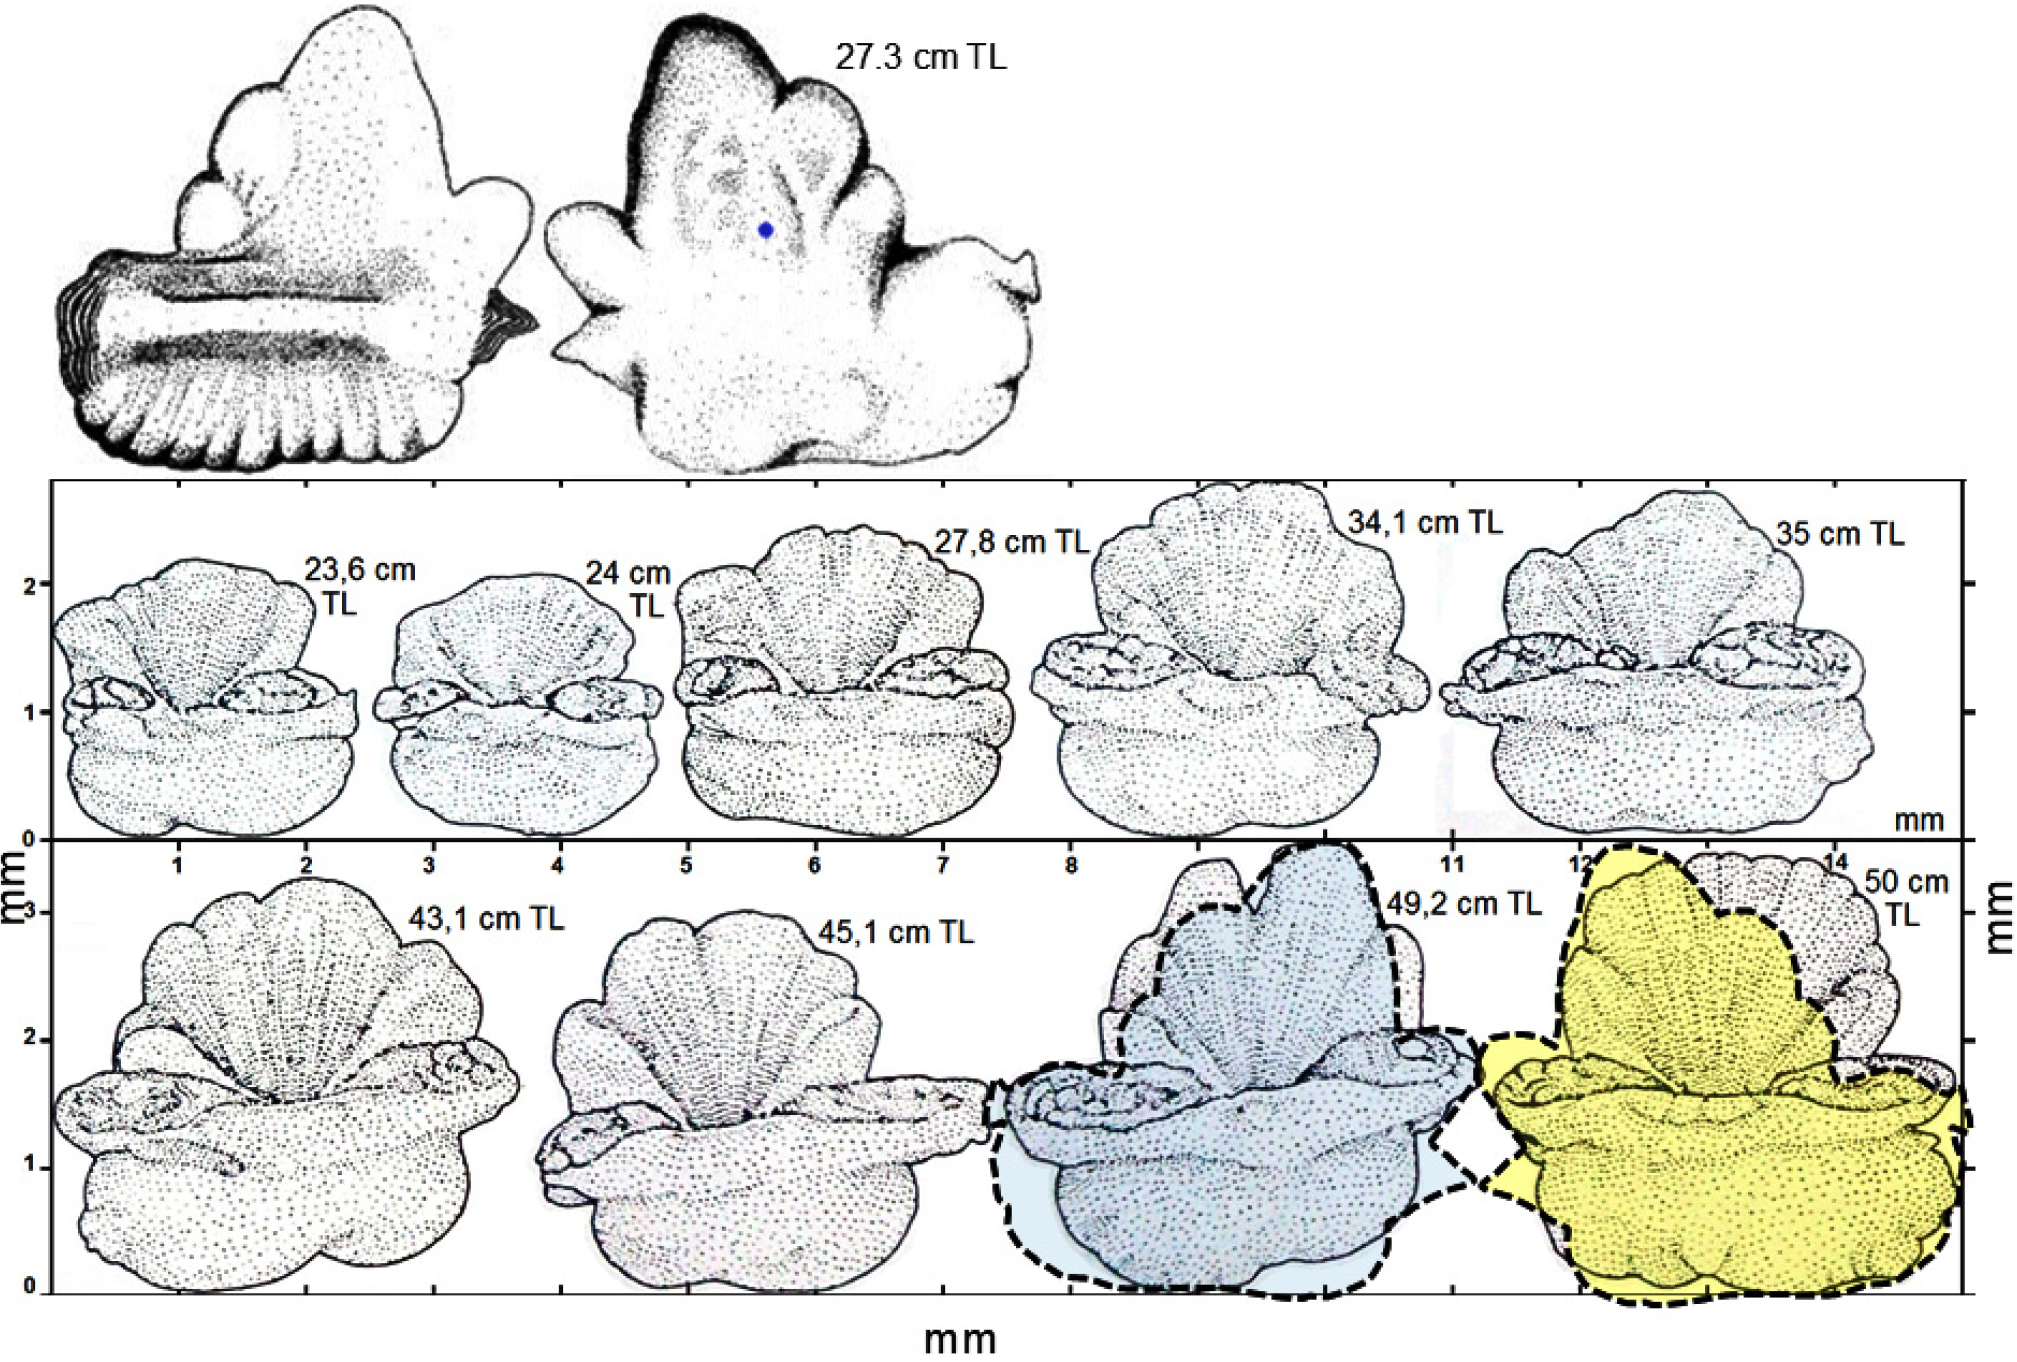
Fig. 18.
Comparison of otoliths of 9 Champ. gunnari from 23.6 cm TL to 50 cm TL collected in 1980 (second and third rows) with otolith of 27.3 cm TL C. gunnari (2 otoliths in first row) cougth later on the shelf of South Georgia. Their red contours do not resemble otoliths from young fish of the same size but only 50 cm adults, that occur in deeper water. That may be an effect of warming by which higher surface temperature determines young fish’s migration to adult habitats.of the colder deep zone Otoliths exhibit profound l changes, probably from dioxins - dissolution of the entire edges of the otoliths, continued gaps of otolith growth that started in the past and otolith size overgrowth indicative of habitat changes by warming that resulted in life strategy changes: early migration to the cold bottom that leads to an increase of otoliths in previously measured adult 50 cm TL icefish. Horizontal and vertical lines are millimeter spacing and are used for alignment, measurement, and comparison
Bone deficiencies may even be the cause of asymmetries seen on the two sides of the body in Chaenodraco wilsoni found in the Antarctic zone not far from research stations (Żabrowski 2000). The two-sided symmetry of the body is the most important evolutionary achievement for the success of any moving species at a higher level of evolution. Therefore, deficiencies and defects in bones as a consequence of an exposure to dioxins, microplastics and other pollutants will disturb the body’s symmetry and impair acoustic perception. Also, the increasingly noticeable defects along an otolith’s edge may well be due to the influence of dioxins, the more so as they do not occur in young Ps. georgianus icefish that spend their time far away from inshore waters at a depth of 400 m or below, but do appear in older fish (Traczyk and Meyer-Rochow 2022), which migrate from the bottom to the shallower coastal zone (where dioxins are present) to reproduce and lay eggs. However, it could also be an adaptation to changes in body mass and the center of gravity occurring annually in large fish during the production of a large amount of spawn mass (Traczyk and Meyer-Rochow 2022).
In Chaen. aceratus and other icefishes the reduction of the otolith mass (Traczyk and Meyer-Rochow 2022), may correspond to the general reduction of ossification in this species to decrease body mass as an adaptation to low temperatures, thereby reducing energy consumption during swimming (Jakubowski 1971). Activity and respiratory metabolism of demersal Chionodraco hamatus (in which Strobel et al. (2018) located dioxin-like polychlorinated biphenyls (di-PCBs)) are the lowest of all icefishes, in spite of their adaptation to increase oxygen diffusion and transport (Jakubowski 1971). In Antarctic waters, dioxins as one component of the untreated wastes of 4,000 people at research stations from 40 countries as well as an increasing number of Antarctic tourists, become concentrated in the neighborhoods of stations in bottom sediments and biota, where dioxin levels reach values known from industrial zones of the Baltic Sea (Meyer-Rochow 1999; Corsolini et al. 2002; Bargagli et al. 2005; González-Pleiter et al. 2021; Caruso et al. 2022; Xie et al. 2022) and would exceed safety levels with regard to permissible levels by European and worldwide standards (Kobusińska et al. 2020). Additional, dioxins are transported from afar by oceanic currents and are adsorbed on ubiquitous microplastic material with sea winds and currents from distant sources around the world (Atkinson 1991; Mechlińska 2011; Erren et al. 2013; Gonzales-Pleiter et al. 2021). An increase in the release of pollutants and especially dioxins of high concentrations from sediments and melting ice has been reported by Urbaniak et al. (2010) as a response to ocean warming, leading to an increased bioaccumulation in the bodies of diatoms, krill, white-blooded fish and other krill-consuming animals as well as fish predators (Corsolini et al. 2002) (Appx. 3).
Monitoring of dioxin in sub-micronutrient concentration < 1 ppt (< 10–8%) and the amounts of microplastics in the Antarctic food chain is difficult, costly, requiring repetitive sampling at sea and time-consuming laboratory work (Jones-Williams et al. 2025), which must be based on validated accreditation certificates, cf., Bachleda-Curuś (2008). Thus, cheaper and safer methods of analysis are needed to examine and interpret distinct signs which are recognizable in otoliths resulting from the influence of dioxins as well as other pollutants and toxins and are affecting the biology and especially the roles of the bones of the skull and skeleton of white-blooded fishes. Dioxins and plastic derivatives such as long-lived hardeners (Erren et al. 2013) can cause deleterious mutagenic changes affecting generations (Brzeski 2011). By their teratogenic and embryotoxic effects, they damage the reproductive material and the species survival (Urbaniak et al. 2010). The CCAMLR has not yet published a formal evaluation of the possible impacts of warming causing a reemission of dioxins accumulated in the past and increasing the threat from dioxins (Kobusińska et al. 2020). The increasing load of microplastics in the polar oceans did receive some attention (Gonzales-Pleiter et al. 2021), but its impact, now even known from wild and farmed salmon (Thiyagarajan et al. 2024), on Antarctic fish life has so far largely been ignored (Aves et al. 2022).
Otoliths altered by an exposure to pollutants become unsuitable for reliable age estimations of icefish (Traczyk and Meyer-Rochow 2022), which is why there is an urgent need that they be collected, measured and interpreted (Fig. 18). They are essential in ageing analyses and stock assessments, but once damaged, they become useless for that purpose and can then only be of value to assess the extent of damage to the Antarctic environment caused by anthropogenic activities, and this should be reflected in the CCAMLR observer manuals of measurement schemes (CCAMLR sec. 2025) on each fishery activity, i.e., commercial as well as research and recorded in otolith libraries (CCAMLR 2025) and databases (CCAMLR 2024).