

1. Introduction
2. Materials and Methods
Experimental Fish
Micro-Polystyrene Treatment, Sampling, and Survival Rate
Expression of SOD, CAT, and Caspase-3 mRNA
SOD and CAT Activities and H2O2 Concentration in Plasma
Terminal Transferase dUTP Nick End Labeling (TUNEL) Assay
Statistical Analysis
3. Results
Survival Rate
Changes in SOD mRNA Expression and Activity
Changes in CAT mRNA Expression and Activity
H2O2 Concentration Trends
Changes in Caspase-3 mRNA Expression
TUNEL Assay
4. Discussion
1. Introduction
Plastic has been extensively used in daily life since its invention in 1905 due to its low price and convenience (Geyer et al. 2017). As of 2019, approximately 370 million tons of plastic have been produced and production is continuously rising (Gao et al. 2021). Generally, when plastic is decomposed by physical or biochemical processes, it becomes microplastic, which has a diameter of less than 5 mm and is difficult to observe directly with the naked eye (Hidalgo-Ruz et al. 2012; Lee et al. 2013).
Microplastic is a novel contaminant that has been discovered in the 21st century. Approximately 3000 particles of microplastic per 1 m³ were detected in the subtropical reflux zone of the North Pacific Ocean (Li et al. 2020), approximately 6000 particles per 1 m³ were detected in the lower Nakdong River in Busan, Korea (Eo et al. 2019), and approximately 2000–6000 particles per 1 m³ were detected in the Yangtze River in China (Zhao et al. 2014). Furthermore, microplastic has been detected in aquatic ecosystems worldwide. It is reported that microplastic is discharged into the water and affects not only marine organisms but also freshwater organisms (Hamed et al. 2020; Song et al. 2020). When a fish consumes microplastic, it causes a feeling of satiety even though the fish has not eaten any food, and it decreases the swimming ability of the fish. Additionally, microplastic is a medium for the transport of endocrine-disrupting substances, such as heavy metals and bisphenol A, which enter the body of fish and affect their capacity to grow and reproduce (Wright et al. 2013; Sussarellu et al. 2016). A recent study reported that as a result of exposure to microplastics, oxidative stress was induced in tissues such as the liver and kidney, resulting in an in vivo antioxidant response (Espinosa et al. 2018).
Antioxidant reactions are processes in which harmful reactive oxygen species (ROS) of living organisms are reduced through enzymes to finally produce harmless H2O and O2 (Mates 2000). ROSs include superoxide (O2-), hydrogen peroxide (H2O2), and hydroxyl radical (OH-) (Roch 1999; Mates 2000), and various antioxidant enzymes for decomposing ROS exist. For example, superoxide dismutase (SOD) converts O2- to H2O2, and catalase (CAT) converts toxic H2O2 into non-toxic O2 and H2O (Kashiwagi et al. 1997). These antioxidant enzymes are mainly active in the liver and kidneys. When an organism is stressed and overproduces ROS, eventually, cell damage and even apoptosis are induced. Therefore, SOD, CAT, and H2O2 in the body are indicators of the antioxidant responses of organisms.
Caspase (cysteinyl aspartate specific proteinase) is an enzyme involved in apoptosis. Among various caspases, caspase-3 is an activated death protease that catalyzes the specific cleavage of many key cell proteins (Porter and Jänicke 1999). Therefore, many studies have investigated the degrees of apoptosis through changes in caspase-3 activity (Jiang et al. 2015).
Goldfish (Carassius auratus) is an ornamental freshwater fish in Asia and Europe, especially in East Asia (Takada et al. 2010). Goldfish have the advantage of being easily available and convenient to breed (De boeck et al. 2010). They are often used for toxicity-related studies because of their high survival rate even in terrible environments (Nilsson and Renshaw 2004; Aliko et al. 2018). Among the many types of microplastic, micro-polystyrene (MP) is widely used for toxicity evaluation. Additionally, MP is often found in marine environments (Besseling et al. 2014; Song et al. 2020).
In the present study, we examined the effect of MP as a contaminant on goldfish. We exposed goldfish to different concentrations of MP and determined mRNA expression levels, antioxidant enzymes levels, and the associated degrees of apoptosis.
2. Materials and Methods
Experimental Fish
Goldfish (C. auratus;body length 6.8±0.8 cm; mass 18.2±4.2 g) were purchased from Choryang aquarium, Busan, Korea, and were acclimated for two weeks in six 300-L freshwater tanks in the laboratory. The water temperature was maintained at 19±1℃ and feeding was stopped 48 h before the experiments.
Micro-Polystyrene Treatment, Sampling, and Survival Rate
Goldfish were exposed to MP (F13080, Thermo Fisher Scientific, USA), with sizes of 1.0 μm, at concentrations of 10 beads/mL (MP 10), 10 beads/mL (MP 100), 1000 beads/mL (MP 1000), or no MP (control group; MP 0). The MP 0 group was only exposed to freshwater with aeration. The concentrations were selected based on previous exposure experiments (Yin et al. 2018; Eo et al. 2019; Song et al. 2020). Each group contained 24 fish. Liver samples were collected from six fish at each of the following times: day 0, day 1, day 3, day 5, and day 7. During the experiments, dead fish were counted to calculate survival and removed from the tanks to prevent pollution. Before sampling, all fish were anesthetized using clove oil (C8392, Sigma, USA). Blood was collected rapidly from the caudal vein using a 1-mL syringe coated with heparin. Plasma samples were separated by centrifugation (4°C at 12,000 × g for 12 min). The samples were stored at -80°C and liver subsamples were stored at room temperature in 10% formalin prior to analysis.
Expression of SOD, CAT, and Caspase-3 mRNA
Total RNA was extracted from the liver using TRI Reagent® (TR188, Molecular Research Center, Inc., USA) according to the manufacturer’s instructions. The A260/ A280 of the RNA was 1.8–2.0 and the A260/A230 was 1.7–2.1. Total RNA (2 μg) was reverse-transcribed to complementary DNA (cDNA) using an oligo-(dT)15 anchor and M-MLV reverse transcriptase (RT0015, Takara, Japan), according to the manufacturer’s protocol. All the synthesized cDNA was diluted (1:50) and stored at -20°C. Relative expression levels of SOD, CAT, caspase-3, and β-actin were measured by real-time quantitative polymerase chain reaction (qPCR). The qPCR primers were designed according to the known sequences in the NCBI database (Table 1). qPCR amplification was conducted using a Bio-Rad iCycler iQ multicolor real-time PCR detection system (Bio-Rad, USA) with iQ SYBR green supermix (Bio-Rad, USA), according to the manufacturer’s instructions. We used the internal control for β-actin and the competitive expression was calculated using the 2-△△Ct method.
Table 1.
Primers used for qPCR amplification
SOD and CAT Activities and H2O2 Concentration in Plasma
H2O2 concentrations in plasma were measured using a peroxide detect™ kit (PD1, Sigma, USA) according to the manufacturer’s instructions. H2O2 concentrations were calculated by measuring the absorbance at 560 nm. SOD and CAT activities were measured using an ELISA kit (MBS705758; MBS038818, MyBiosource Inc, USA), and their absorbance values were measured at 450 nm using a microplate reader, and then used to calculate their activity.
Terminal Transferase dUTP Nick End Labeling (TUNEL) Assay
To evaluate the apoptotic response of the fish liver cells exposed to MP, a TUNEL assay was conducted on fish from the MP 0 and MP 100 groups at day 0, 5, and 7, and fish from the MP 1000 group at day 0 and 5. Fish liver samples were washed and fixed in 10% neutral buffered formalin (F0196RD, BYLABS) using an ApopTag® Peroxidase In Situ Apoptosis Detection Kit (S7100, Sigma-Aldrich, USA), according to the manufacturer’s specifications. Finally, all the slides were observed using an optical microscope (Eclipse Ci, Nikon, Japan). Brown cells indicated apoptosis. Finally, all pictures were assessed using Image pro plus 6.0 (Media Cybernetics, Inc., USA), which was used to calculate the area of apoptosis (the brown cells). The results of the liver cells were compared with those of the liver cell.
Statistical Analysis
All data were analyzed using IBM SPSS Statistics 25.0 (IBM Corp., Armonk, NY, USA). For all the parameters analyzed, a two-way ANOVAfollowed by Tukey’s post- hoc test was used to compare differences between the different MP concentrations and different times of the sample in the data. The significance level was higher than 95% (P < 0.05). Values are expressed as mean±standard error (SE).
3. Results
Survival Rate
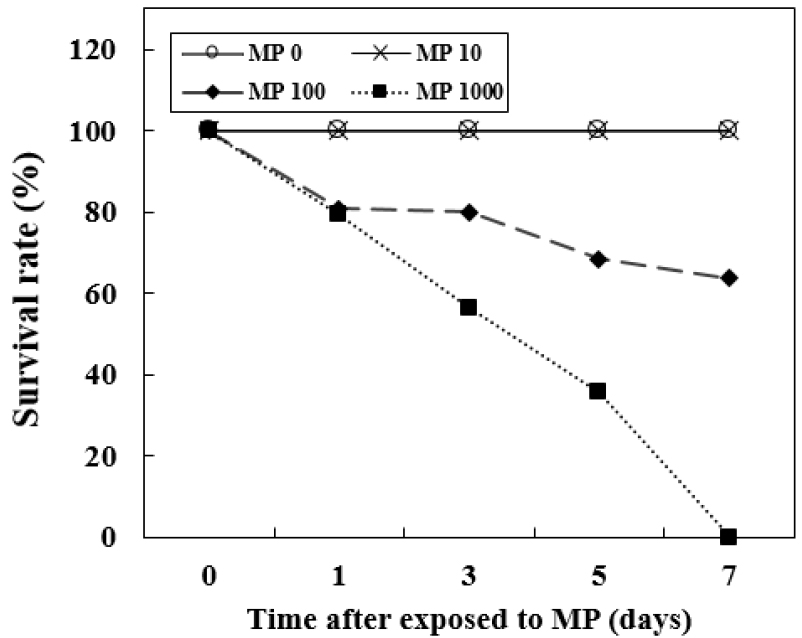
There were no significant differences in survival rate when the MP concentrations were lower than MP 10. No deaths were observed in the MP 0 or MP 10. However, goldfish started to die at day 1 in MP 100. Goldfish in the MP 1000 showed a more rapid decrease in survival rate than those in the MP 100. No fish survived until day 7 in the MP 1000 and the survival rate at day 7 in the MP 100 was 63.6% (Fig. 1). All the fish in the MP 1000 group were dead at day 7, so that there were no individuals for sampling and analysis of parameters.
Changes in SOD mRNA Expression and Activity
In MP 10, SOD expression and activity significantly increased from day 3 (expression: 0.75±0.06, P < 0.05; activity: 3.89±0.10, P < 0.05) and continued to increase (Fig. 2). In MP 1000, SOD expression and activity increased significantly from day 1 (P < 0.05) until the end of the experiment. SOD expression (1.13±0.16, P < 0.05) and activity (15.12±0.08 ng/mL, P < 0.05) levels were the highest in MP 1000 at day 5. All MP-exposed groups showed significantly higher levels of both expression and activity from day 3 (P < 0.05).
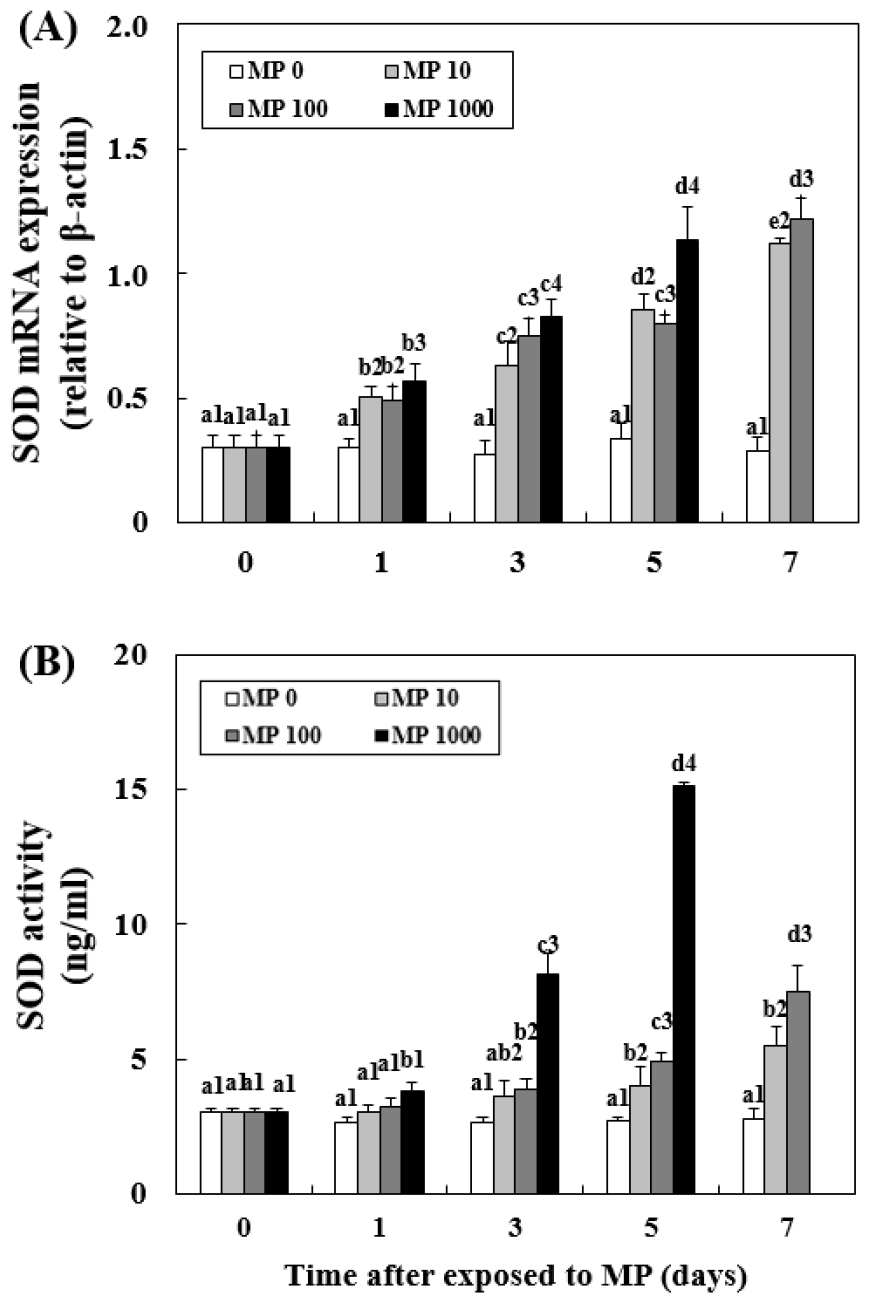
Fig. 2.
Changes in the mRNA expression of superoxide dismutase (SOD) in the liver (A) and SOD activity in the plasma (B) of goldfish exposed to micro- polystyrene (MP; 0, 10, 100 and 1000 beads/mL) measured for 7 d. Different letters indicate significant differences among goldfish exposed to the same MP concentration for different exposure times (P < 0.05). Different numbers indicate significant differences among goldfish exposed to different MP concentrations for the same exposure time (P < 0.05). Values indicate mean±SD (n = 4)
Changes in CAT mRNA Expression and Activity
In MP 10, there was a significant increase in CAT activity (7.70±0.09 U/mL, P < 0.05) at day 1 and a significant increase in CAT expression at day 3 (0.68±0.02, P < 0.05) (Fig. 3). In MP 1000, at day 1, there was a significant increase in CAT expression (0.86±0.08, P < 0.05) and activity (11.11±0.13 U/mL, P < 0.05). When the MP concentration was higher, CAT expression and activity increased significantly. MP 1000 at day 5 had the highest CAT expression (1.42±0.12, P < 0.05) and activity levels (80.32 ±0.18, P < 0.05).
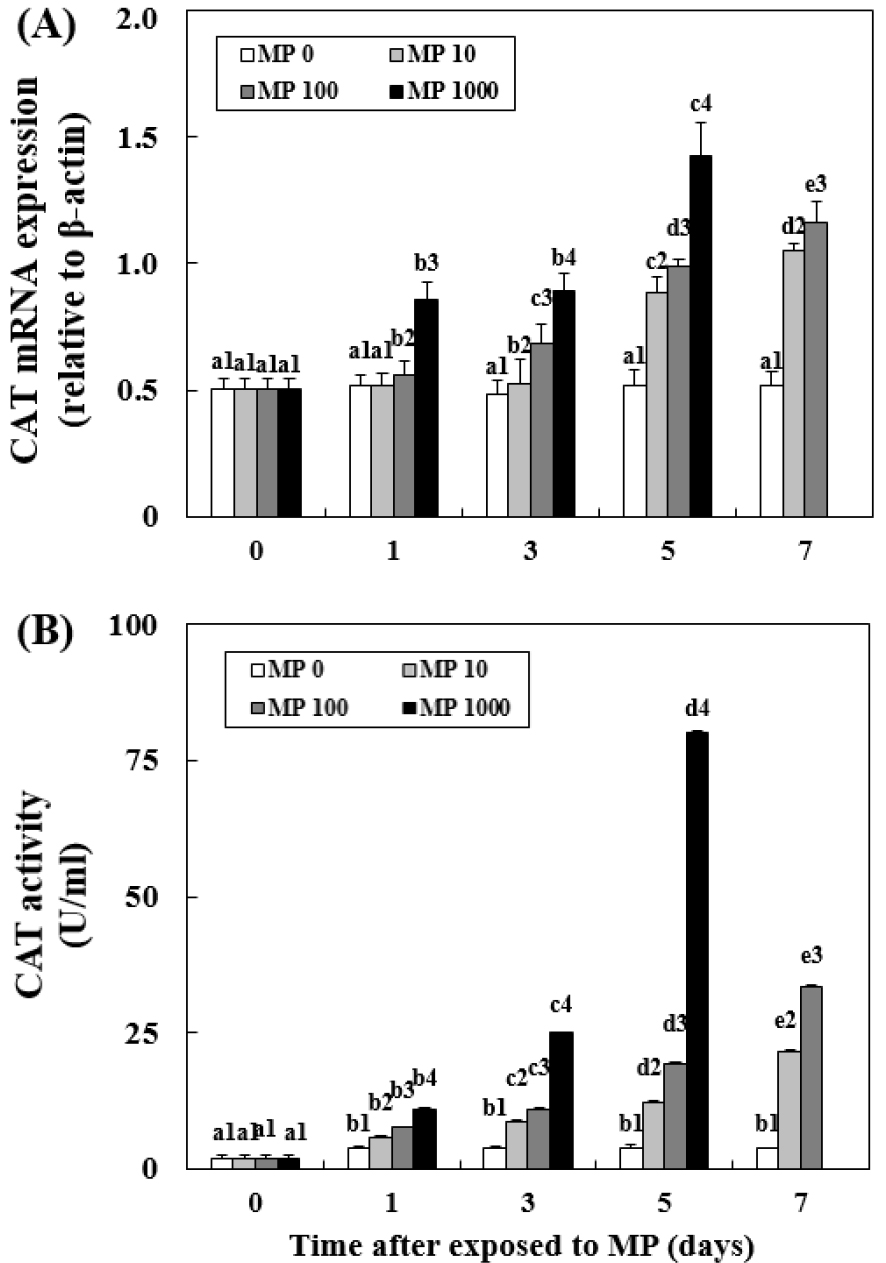
Fig. 3.
Changes in the mRNA expression of catalase (CAT) in the liver (A) and CAT activity in the plasma (B) of goldfish exposed to micro-polystyrene (MP; 0, 10, 100 and 1000 beads/mL) measured for 7 d. Different letters indicate significant differences among goldfish exposed to the same MP concentration for different exposure times (P < 0.05). Different numbers indicate significant differences among goldfish exposed to different MP concentrations for the same exposure time (P < 0.05). Values indicate mean±SD (n = 4)
H2O2 Concentration Trends
The H2O2 concentrations in plasma increased significantly with an increase in MP concentration (Fig. 4). At day 1, the MP exposure groups showed significantly higher concentrations than the control group; however, there was no difference with an increase in the concentration of MP. After day 3, with an increase in the concentration of MP, the H2O2 concentration was higher. However, there were no significant differences between MP 10 and MP 100 at day 5. The highest H2O2 concentrations were observed in MP 1000 at day 5 (7.21±0.12 nmol peroxide/mL, P < 0.05). In MP 100, at day 5, the H2O2 concentrations were still increasing (7.08±0.13 nmol peroxide/mL, P < 0.05).
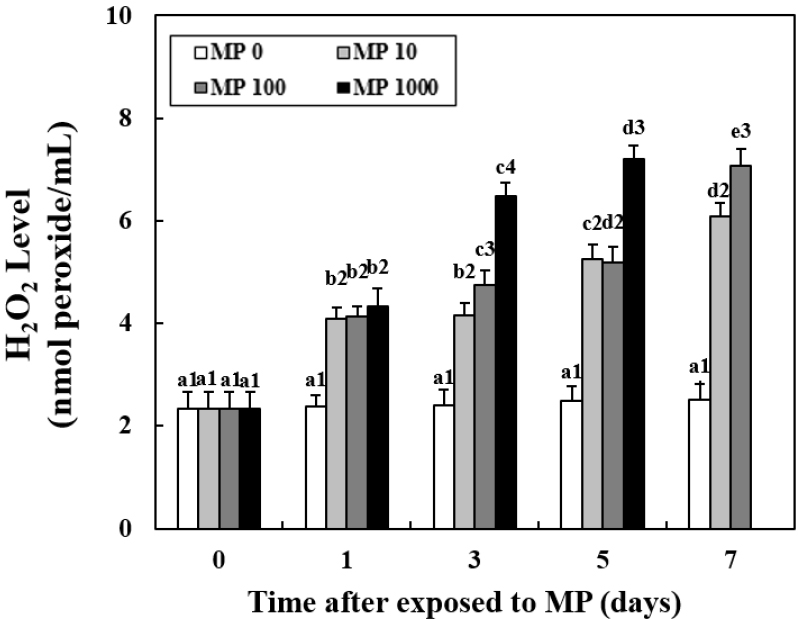
Fig. 4.
Changes in the concentration of H2O2 in the plasma of goldfish exposed to micro-polystyrene (MP; 0, 10, 100 and 1000 beads/mL) measured for 7 d. Different letters indicate significant differences among goldfish exposed to the same MP concentration for different exposure times (P < 0.05). Different numbers indicate significant differences among goldfish exposed to different MP concentrations for the same exposure time (P < 0.05). Values indicate mean±SD (n = 4)
Changes in Caspase-3 mRNA Expression
All MP-exposed groups had an increasing caspase-3 expression trend when compared with MP 0 (Fig. 5). However, before day 5, there were no significant differences between MP 10 and MP 100. Caspase-3 expression was significantly higher in MP 1000 when compared with in all other groups from day 1 (4.61±0.07, P < 0.05). The highest caspase-3 expression levels were observed in MP 1000 at day 5 (5.18±0.10, P < 0.05). There were no changes in caspase-3 expression in MP 0 throughout the experiment.
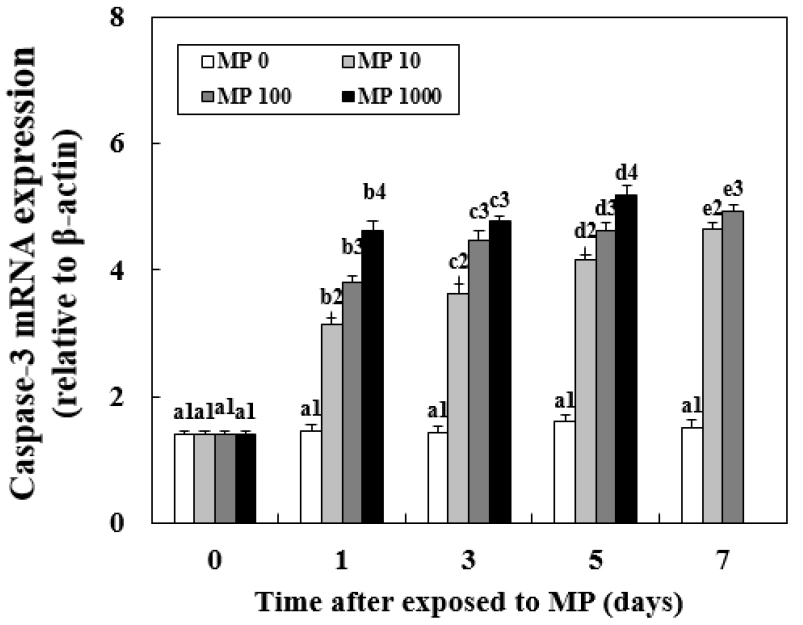
Fig. 5.
Changes in the mRNA expression of caspase-3 in the liver of goldfish exposed to micro-polystyrene (MP; 0, 10, 100 and 1000 beads/mL) measured for 7 d. Different letters indicate significant differences among goldfish exposed to the same MP concentration for different exposure times (P < 0.05). Different numbers indicate significant differences among goldfish exposed to different MP concentrations for the same exposure time (P < 0.05). Values indicate mean±SD (n = 4)
TUNEL Assay
The TUNEL assay was used to investigate the presence of apoptotic cells (Fig. 6). The MP-exposed groups from day 5 had more apoptotic cells than MP 0. At day 5, there were significantly more apoptotic cells in MP 1000 (Fig. 6A, h) than in other groups. There were almost twice as much apoptotic cells in MP 1000 as those in MP 100, and almost three-fold those in MP 0 group in day 5 (Fig. 6B).
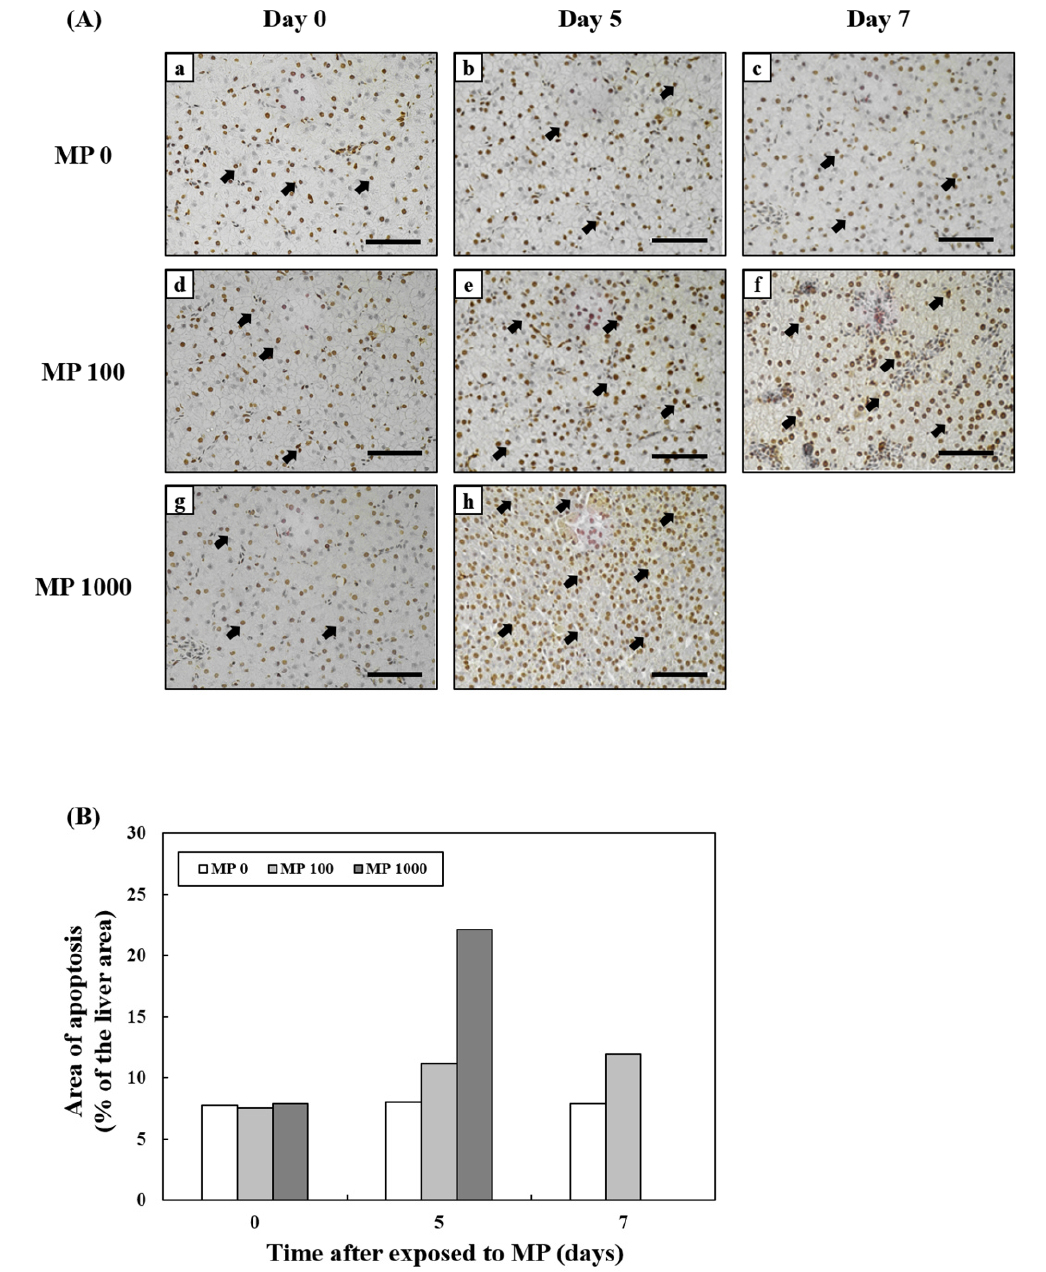
Fig. 6.
Images from a terminal transferase dUTP nick end labeling (TUNEL) assay using liver cells of goldfish exposed to micro-polystyrene (MP) concentrations of 0 and 100 beads/mL at day 0, 5, and 7 (a-f) and an MP concentration of 1000 beads/mL at day 0 and 5 (g and h) (A). Brown cells indicate apoptotic cells. Scale bars = 200 μm. Quantification of TUNEL assay images of the liver cells of goldfish exposed to micro-polystyrene (MP). Changes in areas of apoptosis relative to tissue area (%) (B)
4. Discussion
In our study, goldfish were exposed to MP concentrations of 10, 100, and 1000 beads/mL. Antioxidant response indicators (SOD, CAT and H2O2) in liver tissue and plasma were analyzed following exposure. In order to confirm the degree of cell death, caspase-3 mRNA was determined and a TUNEL assay was carried out.
Death occurred from day 3 in the MP 100 and MP 1000 experimental groups. Finally, at the 7th day, the survival rate was 63.6% in the MP 100 experimental group and all fish in the MP 1000 experiment group had died. The results confirmed that MP is a substance that poses a threat to the survival of goldfish.
In addition, our study analyzed the mRNA expression levels of the antioxidant enzymes SOD and CAT in liver tissue, the activity levels of SOD and CAT, and the concentrations of H2O2, which is a type of ROS, in plasma, after exposure. With an increase in MP concentration and time of exposure, both the mRNA expression levels in the liver and the SOD and CAT activity levels in the plasma of antioxidant enzymes increased significantly. In particular, the plasma SOD and CAT activity levels in the MP 1000 experimental group were higher than those in the other experimental groups on day 5. Yang et al. (2020) reported that when goldfish were exposed to MP concentrations of 10, 100, and 1000 μg/L, there was an increase in SOD, another antioxidant enzyme, glutathione peroxidase (GPx), and ROS activity. In addition, it has been reported that exposure to high concentrations of MP in various aquatic organisms increases antioxidant enzyme levels and ROS activity (Hamed et al. 2020; Song et al. 2020).
In our study, oxidative stress was induced by ROS because of the MP in the tissues. As a result, antioxidant defense mechanisms were activated to remove ROS, which are indicated by the significant increases in the expression levels and activities of SOD and CAT. In particular, in the MP 1000 experiment group, the activity of antioxidant enzymes increased significantly on day 5, but 100% of the goldfish had died by day 7. In the MP 100 and MP 1000, goldfish produced high amounts of ROS in response to MP; however, our results suggest that the ROS production rate was more rapid than the production rate of antioxidant enzymes; therefore, ROS could not be adequately eliminated, which eventually led to fish death.
In our study, the expression levels of caspase-3 mRNA in liver tissue were analyzed in relation to apoptosis. Similar to the expression patterns of antioxidant enzymes, caspase-3 mRNA expression increased as the MP concentration and exposure time increased. Choi et al. (2018) exposed sheepshead minnow (Cyprinodont variegatus) to polyethylene microspheres at concentrations of 0, 50, and 250 mg/L for 4 d and found that the caspase-3 mRNA expression level was significantly increased in the 250 mg/L experiment group. In our study, the TUNEL assay confirmed apoptosis in liver tissues. Apoptosis in the MP 1000 experimental group was significantly higher than that in the MP 100 and MP 0 experimental groups at the same exposure time. Qiang and Cheng (2021) reported that after exposing zebrafish (Danio rerio) to MP concentrations of 10, 100, and 1000 μg/L for 3 weeks, higher apoptosis levels were observed in experimental groups with higher MP concentrations. Together with our caspase-3 results, this confirms that a high concentration of MP induces an increase in apoptosis in liver tissue.
In conclusion, MP at a concentration of 10 beads/mL had minimal effect on the survival of goldfish within 7 d. However, the high levels of antioxidant responses in vivo suggest that long-term exposure to MP at 10 beads/ mL may have negative effects on the goldfish survival. In addition, MP concentrations of 100 and 1000 beads/mL not only induced oxidative stress in goldfish but also induced apoptosis, suggesting that even short-term exposure could have significant effects on the mortality of goldfish. Other researchers have showed that different size of microplastic could cause different toxicity responses in vivo. According to Tallec et al. (2018), nanoplastics exerted greater toxicity to fertilization and embryogenesis processes in oyster than microplastics. In addition, Yin et al. (2021) reported that nanoplastics exhibited greater toxicity levels in different organs than microplastics. Further research is required to investigate the potential negative effects of different types, sizes, and shapes of microplastics in aquatic organisms.
