


1. Introduction
2. Materials and Methods
Triplicate cultivation experiments under different temperature, salinity, and photon flux conditions
Calculation of growth rate and biomass yield of epiphytic dinoflagellate strains
Two types of maximum growth rate and maximum biomass yield estimation
Null hypothesis test regarding the difference between the two calculation methods for average maximum growth rate or average maximum biomass yield
3. Results and Discussion
Maximum growth rate and elapsed days
Maximum biomass yield and elapsed days
Scatter plots of 16 data points for GRmax and Ymax on the planes of the “Triplicate Mean” axis and the “Mean of each 3” axis.
Third type of GRmax and Ymax derived from each of the three replicate bottles on the day the “Triplicate Mean” GRmax and Ymax were obtained
4. Conclusion
Maximum growth rate and maximum biomass yield
Dispersion in time-to-peak data sets for GRmax and Ymax
Quantifying the level of synchronization among three replicate cultures
1. Introduction
Measuring the growth rate of natural epiphytic dinoflagellates (EPDs) inhabiting 3D-structured thalli (Yong et al. 2018; Lee et al. 2020) of various marine macroalgae species (Drouet et al. 2022; Cohu et al. 2011) requires a tedious and sophisticated methodology. In the laboratory experiments using clonal cultures, measuring the growth rate and biomass yield is relatively more convenient and consistent due to controlled experimental conditions. To determine the most reproducible values from the laboratory cultivation experiments, triplicates, quadruplicates or quintuplicates of culture bottles or culture tubes can be used for each test condition (Mussai et al. 2023; Chen et al. 2024).
To calculate the maximum growth (GRmax) rate and maximum biomass yield (Ymax), time courses of both bottle-specific cell counts and mean cell counts of the replicate bottles can be used. Three sets of GRmax and Ymax can be obtained from the three time-series of the bottle-specific cell counts, whereas only one GRmax and Ymax can be derived from a time series of triplicate mean cell counts. The average GRmax and Ymax of the three sets from three replicate series (Oh et al. 2023; Park et al. 2021; Hashimoto et al. 2021) can be compared with the single GRmax and Ymax from a triplicate mean series (Corson and Millette 2024; Roux et al. 2021; Park et al. 2006) to determine the better representative of GRmax and Ymax. In the ideal case of perfect experiments, the two values for GRmax and Ymax should be identical regardless of calculation method.
Here, we tested our null hypothesis (H₀) based on cell counting data from triplicate cultivation experiments under different temperature, salinity, and photon flux conditions using the two epiphytic dinoflagellate strains isolated from Jeju coastal waters of Korea, Ostreopsis sp. and Coolia canariensis (Oh et al. 2023): “The average GRmax and the average Ymax of the three sets from the triplicate series and GRmax and Ymax from triplicate mean series are equal in our triplicate cultivation experiment using the two potentially toxic EPD strains”. If our null hypothesis (H₀) is not rejected, either of the two calculation methods can be adopted for determining GRmax and Ymax estimates for the two Korean strains, and possibly also for other similar replicate experiments using EPD strains.
2. Materials and Methods
Triplicate cultivation experiments under different temperature, salinity, and photon flux conditions
Triplicate batch culture experiments were conducted using two clonal cultures of epiphytic dinoflagellates (EPDs). The two potentially toxic strains, Ostreopsis sp. and Coolia canariensis, were isolated from the blades of a macroalgal species (Gelidium amansii) collected via diving at a depth of 3 m off Aewol (33°28′04.78" N and 126°19′23.69" E) on Jeju Island, with an ambient water temperature and salinity of 14.8°C and 33.7, respectively, in February 2009 (Oh et al. 2023). Following single-cell isolation, the two clonal cultures were established by serially transferring cells every 3 weeks to bottles containing f/2 medium at a temperature of 20°C and a salinity of 30 under continuous illumination of 60 μmol photons m-2 s-1.
The unialgal cultures of the two EPD strains were grown in triplicate 500-ml PC bottles for 34 days under different temperatures (15, 20, 25, 30, and 35°C), salinities (15, 20, 25, 30, and 35), and illumination levels (10, 20, 50, 100, 200 and 300 μmol photons m-2 s-1) conditions. Each bottle was shaken vigorously by hand over 50 times daily to detach any potentially attached or aggregated dinoflagellate cells. After the vigorous shaking, a 5-ml subsample was collected from each bottle every two days. Cell counts were performed using an optical microscope (Zeiss AxioCam HRc5, Carl Zeiss Ltd., Göttingen, Germany) and Sedgewick-Rafter counting chambers (LeGresley and McDermott 2010). The baseline incubation conditions for all the triplicate bottle cultures were 25°C and 30 salinity under continuous illumination with a cool-white fluorescent lamp at 50 μmol photons m-2 s-1 (Oh et al. 2023).
Calculation of growth rate and biomass yield of epiphytic dinoflagellate strains
For the growth rate estimation, the 4-day average daily specific growth rate (SDA-GR, μ) of each experimental culture was calculated as follows:
μ = [Ln (Ct2 / Ct1)] / (t2- t1)
where Ct1 and Ct2 are the cell counts at incubation times t1 and t2, respectively. To calculate the SDA-GR, the time interval for (t2- t1) was set to 4 days. To reduce counting noise, the first and third data points (not the first and second) were chosen for the growth rate estimation, which gave the 4-day average daily specific growth rate. The maximum value among the 16 SDA-GR values calculated from the population growth curve was designated as the maximum growth rate (GRmax).
The maximum biomass yield (Ymax) of each bottle was determined as the cell counts at the highest peak or maximum point on the population growth curve during the 34-day cultivation experiment.
Two types of maximum growth rate and maximum biomass yield estimation
The average of three GRmax values and the average of three Ymax values obtained from three replicate bottles (Fig. 1a and b) were calculated to derive the “Mean of Each 3” GRmax and “Mean of Each 3” Ymax. The “Triplicate Mean” GRmax and “Triplicate Mean” Ymax were derived from the daily average time series (Fig. 1c and d) of the cell counts data obtained from the three replicate bottles.
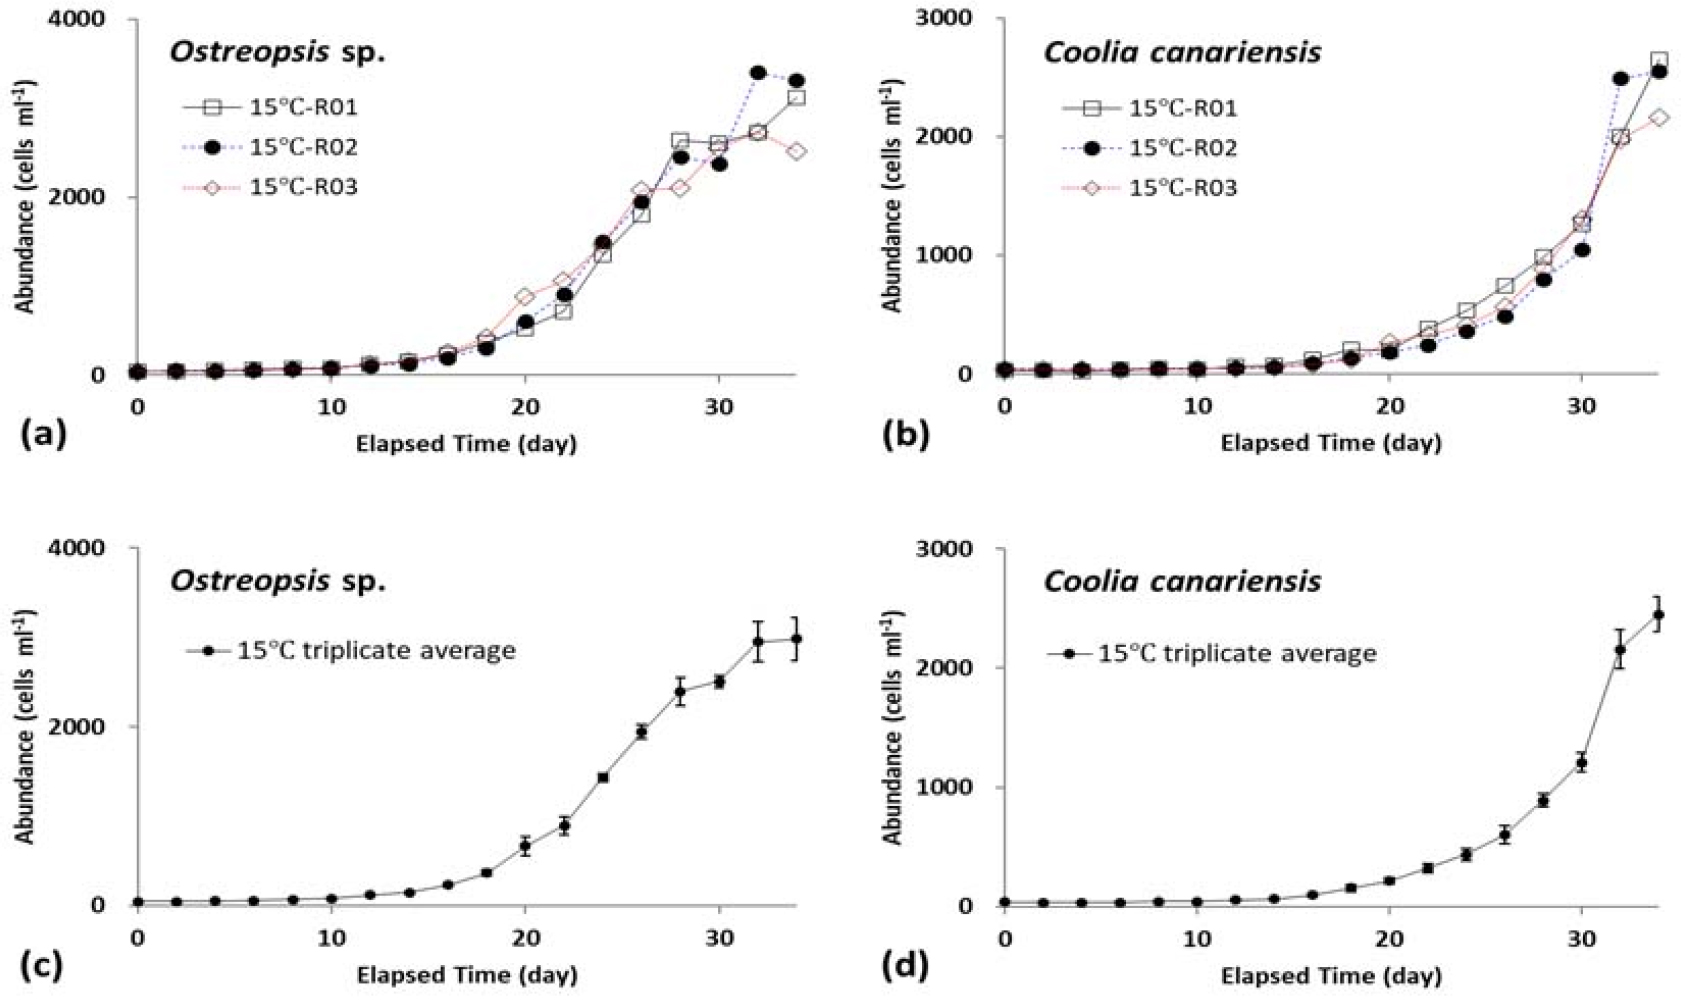
Fig. 1.
Cell densities of the epiphytic dinoflagellate Ostreopsis sp. (a, c) and C. canariensis (b, d) strains in triplicate culture experiments at 15°C for 34 days. The cell densities of each of the three replicate experiments (a, b) and the daily mean cell densities of the three replicate experiments (c, d) are shown
For further data analysis, three growth rates and biomass yield values were calculated for each of the three replicate bottles on the day the “Triplicate Mean” GRmax and “Triplicate Mean” Ymax were obtained. The two resulting average values were named the “3d-Triplicate Mean” GRmax and “3d-Triplicate Mean” Ymax, respectively.
Null hypothesis test regarding the difference between the two calculation methods for average maximum growth rate or average maximum biomass yield
A null hypothesis test was performed on the differences between the two mean values obtained by the calculation methods (“Mean of Each 3” and “Triplicate Mean”) for GRmax and Ymax under all temperature (15, 20, 25, 30, and 35°C), salinity (15, 20, 25, 30, and 35), and illumination (10, 20, 50, 100, 200, and 300 μmol photons m-2 s-1) conditions. The independent t-tests were executed in Microsoft Excel LTSC 2021 (version 16.0) using the two-sample equal variance worksheet function: =T.TEST(array1, array2, 2, 2).
3. Results and Discussion
Maximum growth rate and elapsed days
The “Mean of Each 3” maximum growth rate (GRmax) of Ostreopsis sp. was highest at 20°C (with a μ of 0.355), salinity 35 (0.282), and 100 μmol photons m-2 s-1 (0.424), and the “Triplicate Mean” GRmax was highest at 20°C (0.344), salinity 35 (0.268), and 100 μmol photons m-2 s-1 (0.408) (Fig. 2a and b, and c in the left six graphs). Surprisingly, the two GRmax sets exhibited peak values in C. canariensis at a higher temperature (25°C, μ = 0.500 for “Mean of Each 3” and 0.464 for “Triplicate Mean”), lower salinity (30; 0.452 and 0.419, respectively), and lower illumination (50 μmol photons m-2 s-1, 0.567 and 0.508, respectively) (Fig. 2d, e and f of the six graphs on the left). In addition, considering the scale and location of negative growth (white circles in Fig.2), it was confirmed once again that the C. canariensis strain exhibits more stenothermal, stenohaline, and euryphotic characteristics compared to the Ostreopsis sp. strain (Oh et al. 2023).
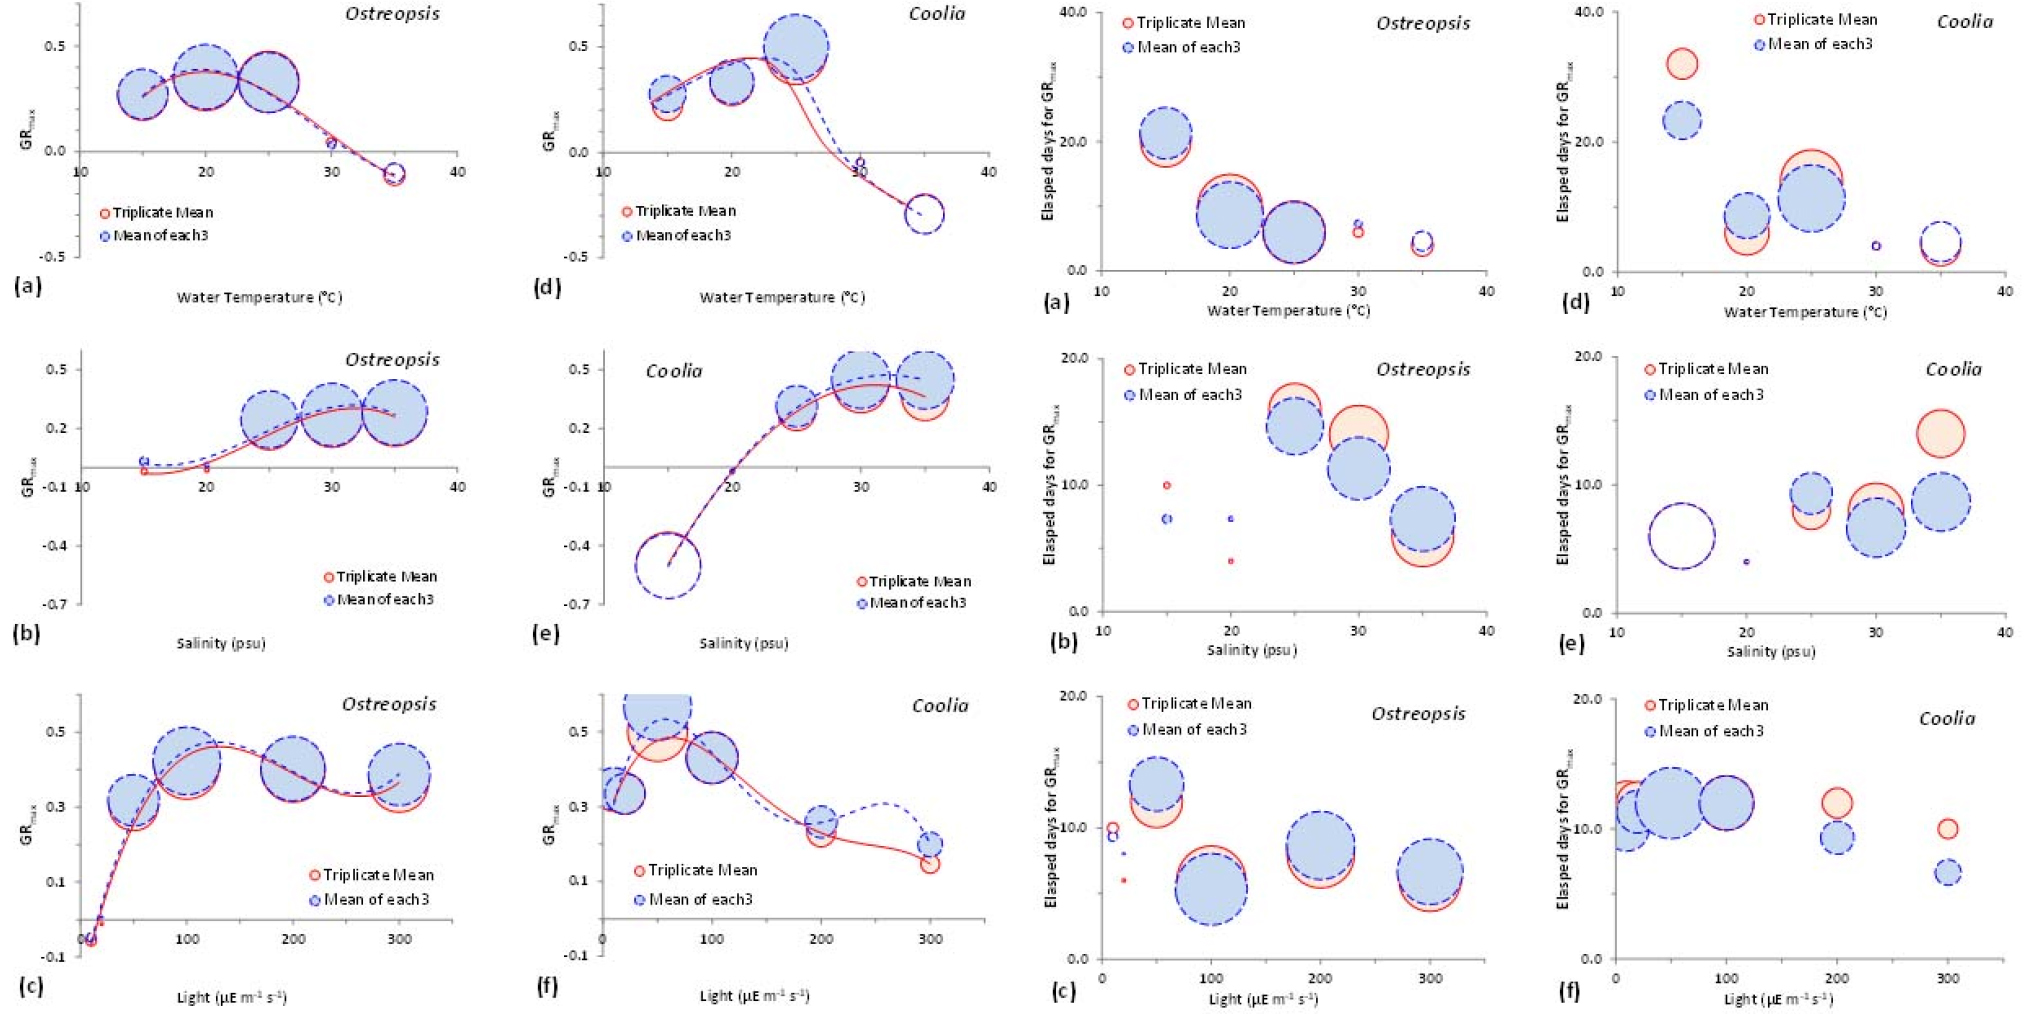
Fig. 2.
Maximum growth rate (GRmax) (six graphs on the left) and elapsed days for maximum growth rates (GRmax) (six graphs on the right) of the epiphytic dinoflagellate strains Ostreopsis sp. (a–c) and C. canariensis (d–f) plotted as a function of water temperature (a, d), salinity (b, e) and light intensity (c, f). GRmax is the maximum SDA-GR (4d averaged daily specific growth rate) from a series of daily triplicate mean data (“Triplicate Mean”) or the mean of three maximum SDA-GR values obtained in each bottle data series (“Mean of each 3”). The diameter of a circle represents a relative GRmax in each balloon diagram. Filled and empty circles represent positive and negative growth rates, respectively
In the six graphs on the left of Fig. 2, the two sets of GRmax (“Mean of Each 3” and “Triplicate Mean”) were found to be very close to each other, except for slight differences under several environmental conditions (15°C and salinity 35 for C. canariensis, 300 μmol photons m-2 s-1 for Ostreopsis sp., and 50, 200, and 300 μmol photons m-2 s-1 for C. canariensis). The exceptional minor difference was relatively more evident when C. canariensis responded to higher photon flux (Fig. 2f of the six graphs on the left). The fact that the “Triplicate Mean” growth rate of C. canariensis was noticeably lower under conditions of salinity 35 and illumination of 50, 200, and 300 μmol photons m-2 s-1 (Fig. 2) suggests that the “Triplicate Mean” calculation may have been underestimated compared to the “Mean of Each 3” calculation.
The elapsed days for Ostreopsis sp. (Fig. 2a, b, and c of the six graphs on the right) and for C. canariensis (Fig. 2d, e, and f of the six graphs on the right) to reach the two GRmax values (“Mean of Each 3” and “Triplicate Mean”) revealed more distinct difference between the two values. Although the initial, exponential, and stationary phases of population growth in the three replicate cultures were not always perfectly synchronized, the GRmax values calculated during the exponential growth phase of each of the three cultures were very close to each other (See Fig. 1). Theoretically, synchronization of the three cultures can be expected only when there are absolutely no artificial errors during the experiment. However, the actual degree of synchronization of the three cultures itself may, in part, reflect the level of capability to perform laboratory replicate-bottle cultivation experiments using epiphytic dinoflagellate strains (see Fig. 1). This performance capability should include the experimenter’s ability to optimize the biological acclimation state of the experimental cultures and minimize microenvironmental differences, inoculation variability, and errors in population density estimation.
Maximum biomass yield and elapsed days
The “Mean of Each 3” log-normalized Ymax of Ostreopsis sp. showed ln(Ymax) values of 8.034, 8.099, and 7.903 at 15, 20, and 25°C, respectively, which were twice as high as the ln (Ymax) values at 30 and 35°C (4.179 and 3.926, respectively) (Fig. 3a of the six graphs on the left). Here, a Ymax value of 4.0 in log-normalized scale corresponds to an EPD abundance of 55 cells ml-1, which is very close to the target concentration (50 cells ml-1) on day 0. The maximum growth rate (GRmax) of Ostreopsis sp. peaked at 20°C with smaller values at 15°C and 25°C (Fig. 2a of the six graphs on the left). However, the Ymax values of Ostreopsis sp. were nearly identical across these three temperatures, and no distinct growth was observed at the higher temperatures of 30 and 35°C (Fig. 3a of the six graphs on the left). The “Mean of Each 3” ln(Ymax) values of C. canariensis, however, increased from 7.805 at 15°C to 9.109 at 20°C, and to 9.367 at 25°C, while no substantial growth was observed at higher temperatures of 30 and 35°C (Fig. 3d of the six graphs on the left).
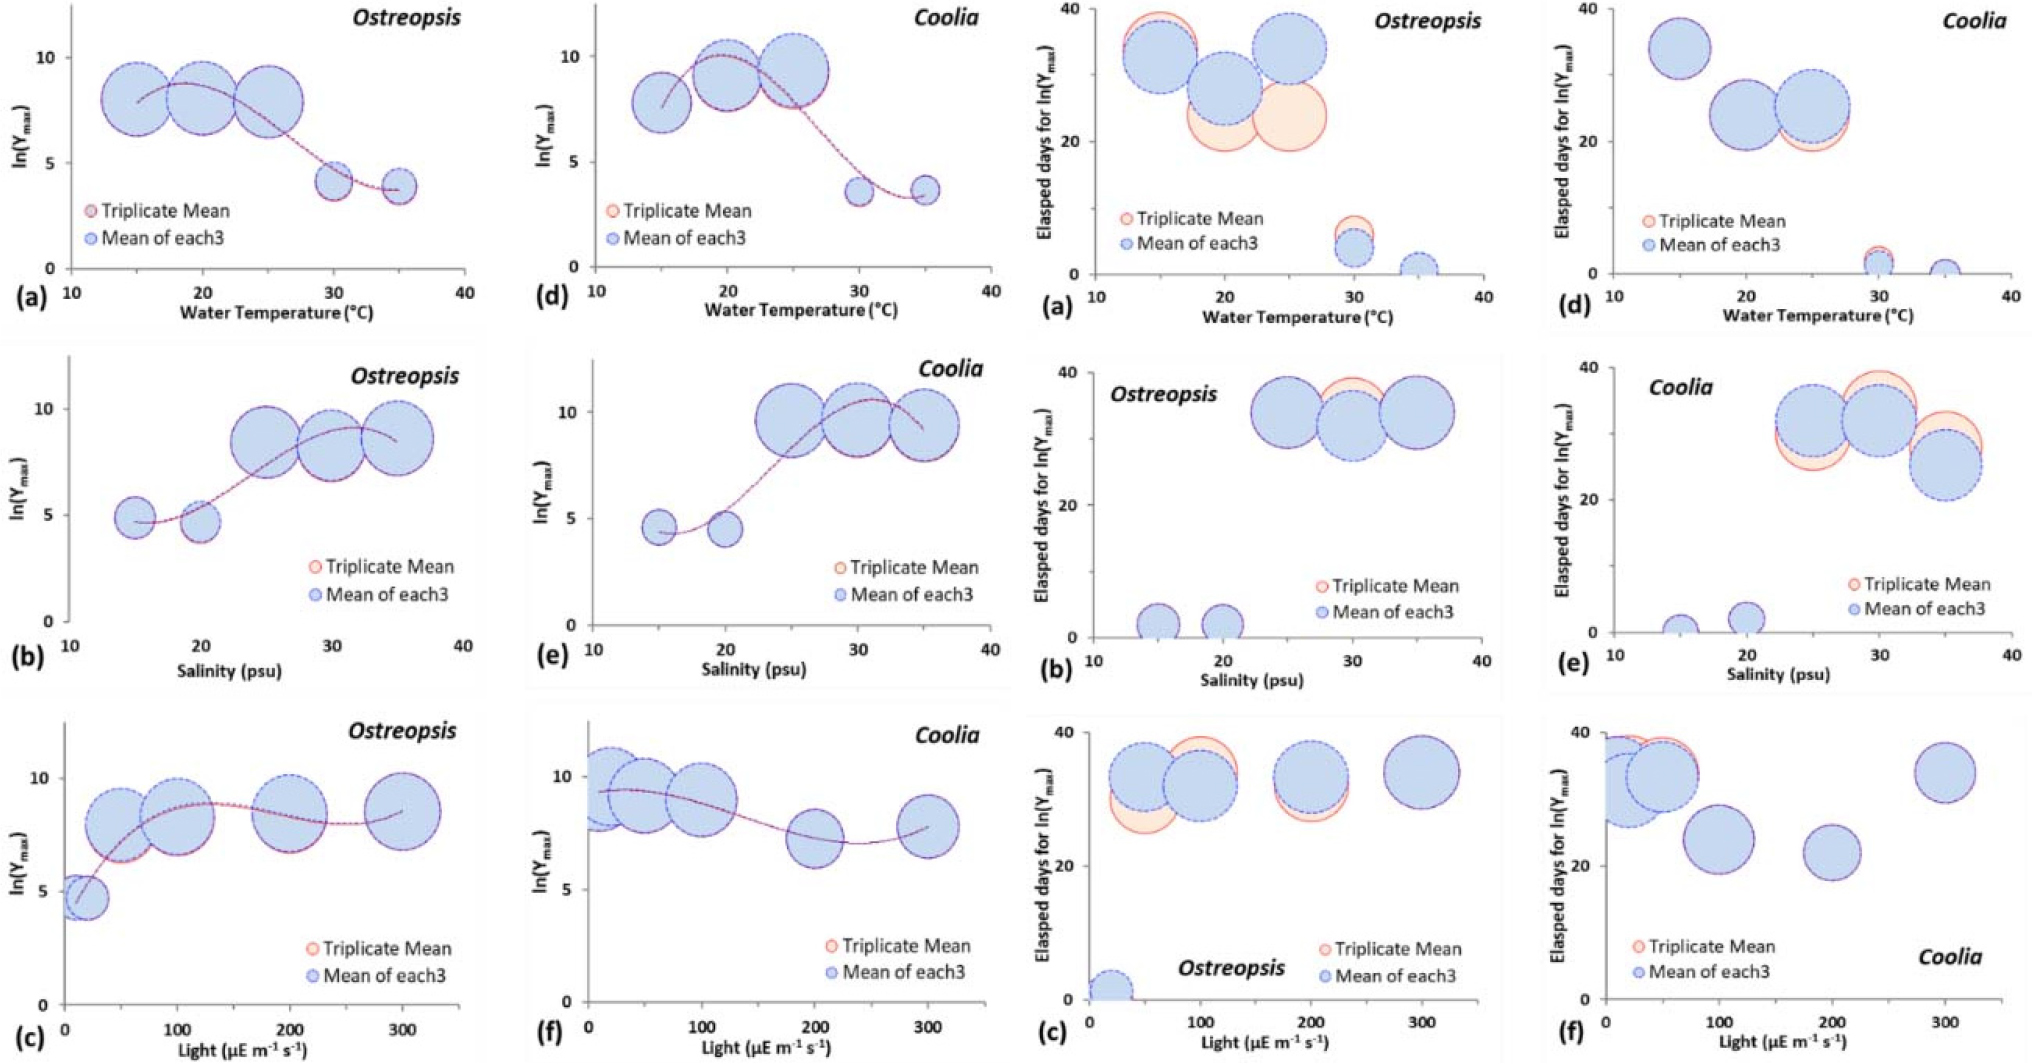
Fig. 3.
Maximum biomass yields (Ymax) (six graphs on the left) and elapsed days for maximum biomass yields (Ymax) (six graphs on the right) of the epiphytic dinoflagellate strains Ostreopsis sp. (a–c) and C. canariensis (d–f) plotted as a function of water temperature (a, d), salinity (b, e) and light intensity (c, f). Ymax is the maximum biomass yield from a series of daily triplicate mean data (“Triplicate Mean”) or the mean of three Ymax values obtained in each bottle data series (“Mean of each 3”) during a 34-d cultivation experiment. The diameter of a circle also represents a relative Ymax in each balloon diagram. Solid circles and dotted circles represent “Triplicate Mean” and “Mean of each 3”, respectively
The “Mean of Each 3” Ymax values at three higher salinities (25, 30, and 35) were again very close to each other, and there was no substantial growth in both Ostreopsis sp. and C. canariensis at the other two lower salinities of 15 and 20 (Fig. 3a and d of the six graphs on the left). The “Mean of Each 3” Ymax values of Ostreopsis sp. were almost equally high at the four highest photon fluxes (50, 100, 200 and 300 μmol photons m-2 s-1) and showed minimum values at the remaining two low photon fluxes (10 and 20 μmol photons m-2 s-1). This stands in stark contrast to the euryphotic nature of C. canariensis with roughly equal Ymax values at all photon fluxes (six graphs on the left of Fig. 3). In both Ostreopsis sp. and C. canariensis, under all 16 environmental conditions (six graphs on the left of Fig. 3), the two sets of Ymax (“Mean of Each 3” and “Triplicate Mean”) were found to be very close to each other without exception.
In both Ostreopsis sp. (Fig. 3a, b, and c of the six graphs on the right) and C. canariensis (Fig. 3d, e, and f of the six graphs on the right), the difference between the two sets (“Mean of Each 3” and “Triplicate Mean”) in the number of days to reach Ymax was more pronounced than in the case of GRmax (six graphs on the right of Fig. 2). The elapsed days for each of the three replicate cultures to reach Ymax may differ from one another because the initial, exponential, and stationary growth phases of each culture may not always be perfectly synchronized (see Fig. 1). Theoretically, synchronization of the time to reach Ymax in the three cultures can be expected only when there are absolutely no experimental errors. However, the degree of synchronization among the three cultures may, in part, be affected by the actual biological performance of the inoculated EPD cells or minor micro-environmental fluctuations within the incubator (see Fig. 1).
Scatter plots of 16 data points for GRmax and Ymax on the planes of the “Triplicate Mean” axis and the “Mean of each 3” axis.
In both Ostreopsis sp. and C. canariensis, the “Triplicate Mean” GRmax (maximum SDA-GR (a 4d-averaged daily specific growth rate) from a series of daily triplicate mean data) and the “Mean of each 3” GRmax (mean of the three GRmax values obtained from each of the three bottle data series) were almost identical across the T, S, and L experiments (Fig. 2a, b and c of the six graphs on the left), as was the case for Ymax (Fig. 2d, e and f of the six graphs on the left). When plotted on the “Triplicate Mean” axis and the “Mean of each 3” axis, the 16 pairs of mean GRmax values showed a positive linear regression with R2 > 0.993 (Fig. 4a and c of the six graphs on the left) while those of Ymax values did a linear regression with R2 > 0.9997 (Fig. 4a and c of the six graphs on the right). On the planes of the “Triplicate Mean” axis and the “Mean of each 3” axis, the elapsed days to reach corresponding GRmax and Ymax values showed linear regression with relatively much lower R2 value (< 0.897) (Fig. 4b and d of the six graphs on the left) and a similar R2 value (< 0.992), respectively (Fig. 4b and d of the six graphs on the right). Therefore, by quantifying this in the form of a correlation coefficient or the coefficient of determination in linear regression analysis, the level of synchronization of the triplicate cultures in the laboratory using EPD strains might be numerically expressed.
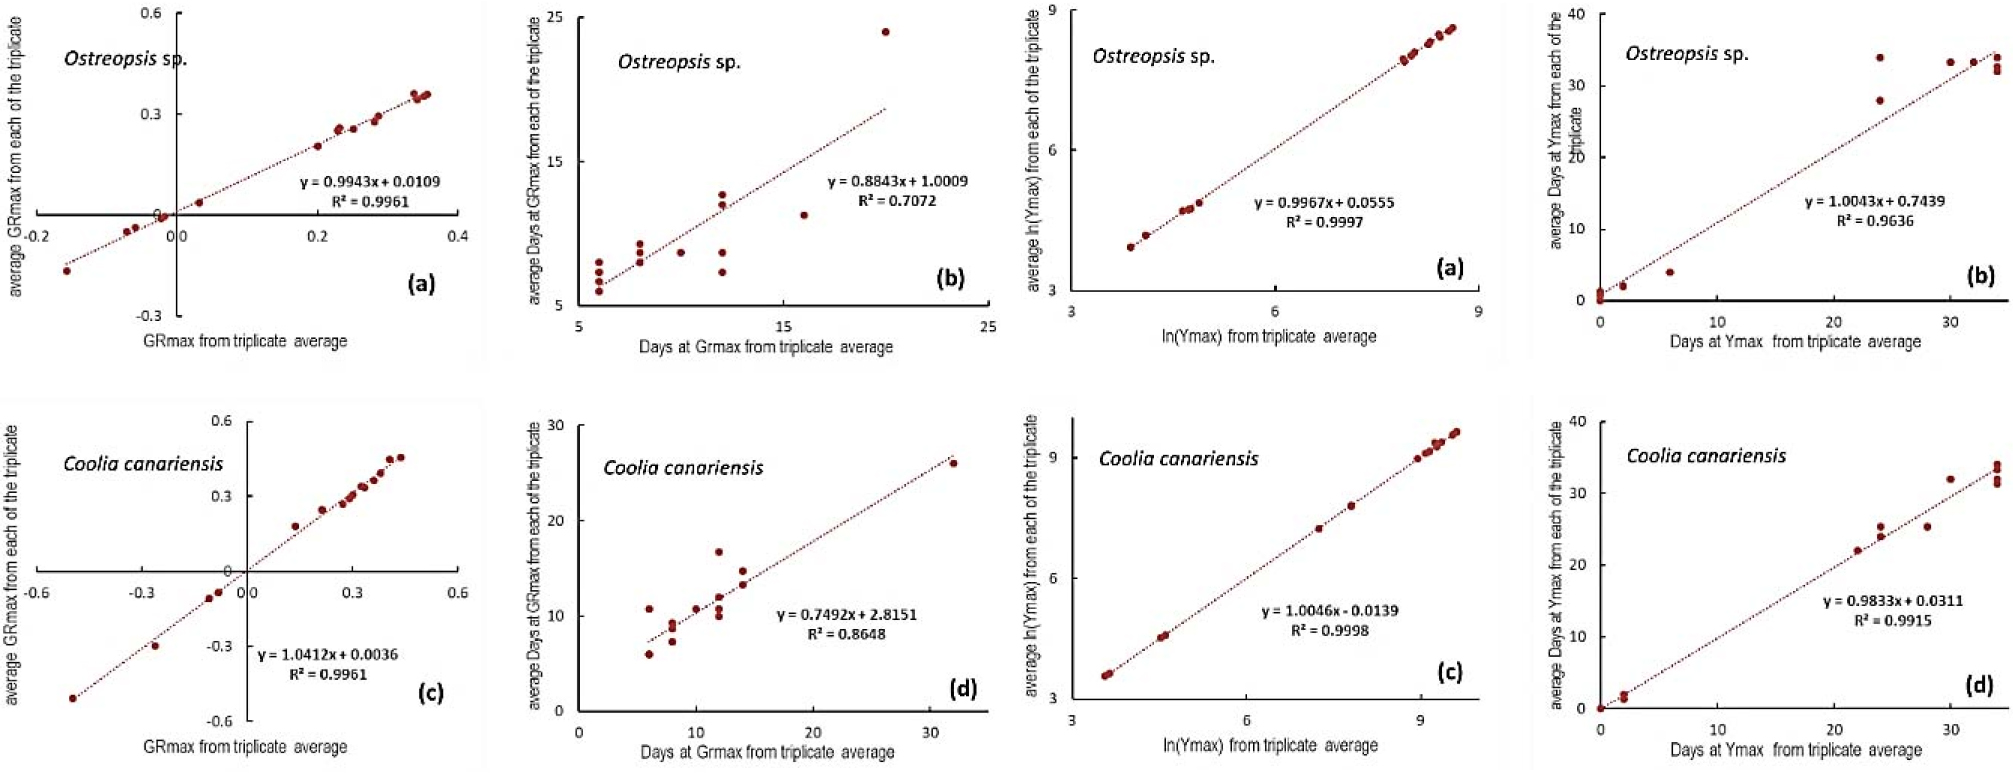
Fig. 4.
Scatter plots of 16 data points for maximum growth rate (four graphs on the left) and maximum biomass yield (four graphs on the right) on the planes of the “triplicate average” (x-axis) and the “each of the triplicates” (y-axis). All GRmax values and elapsed days data in the 4 graphs on the left (see Fig. 2), or all Ymax values and elapsed days data in the four graphs on the right (see Fig. 3), are aggregated from data obtained from T, S, and L triplicate bottle experiments with the epiphytic dinoflagellate strains Ostreopsis sp. (a, b) and C. canariensis (c, d)
Third type of GRmax and Ymax derived from each of the three replicate bottles on the day the “Triplicate Mean” GRmax and Ymax were obtained
The average of the three growth rates calculated from replicate bottles on the day of the “Triplicate Mean” GRmax was defined as the “3d-Triplicate Mean” GRmax. Likewise, the average of the three biomass data points on the day of the “Triplicate Mean” Ymax was defined as the “3d-Triplicate Mean” Ymax. For both Ostreopsis sp. and C. canariensis, under all 16 T, S, and L combination conditions, the “3d-Triplicate Mean” and “Mean of each 3” did not show any statistically significant difference (t-test, p > 0.05, Table 1) for either GRmax (the six graphs on the left of Fig. 5) or Ymax, (the six graphs on the right of Fig. 5). This result further clarifies that the “Triplicate Mean” and “Mean of each 3” values for both GRmax and Ymax are not statistically different in this study using Ostreopsis sp. and C. canariensis. This is because there was no statistically significant difference even between the “3d-Triplicate Mean” and “Mean of each 3” values for both GRmax and Ymax. Data from the highly synchronized triplicate-bottle cultures of EPD strains can show nearly identical GRmax and Ymax values regardless of the analysis methods used to derive the “Mean of each 3” and “Triplicate Mean” (Fig. 4), or even the “3d-Triplicate Mean” (Fig. 5, Table 1).
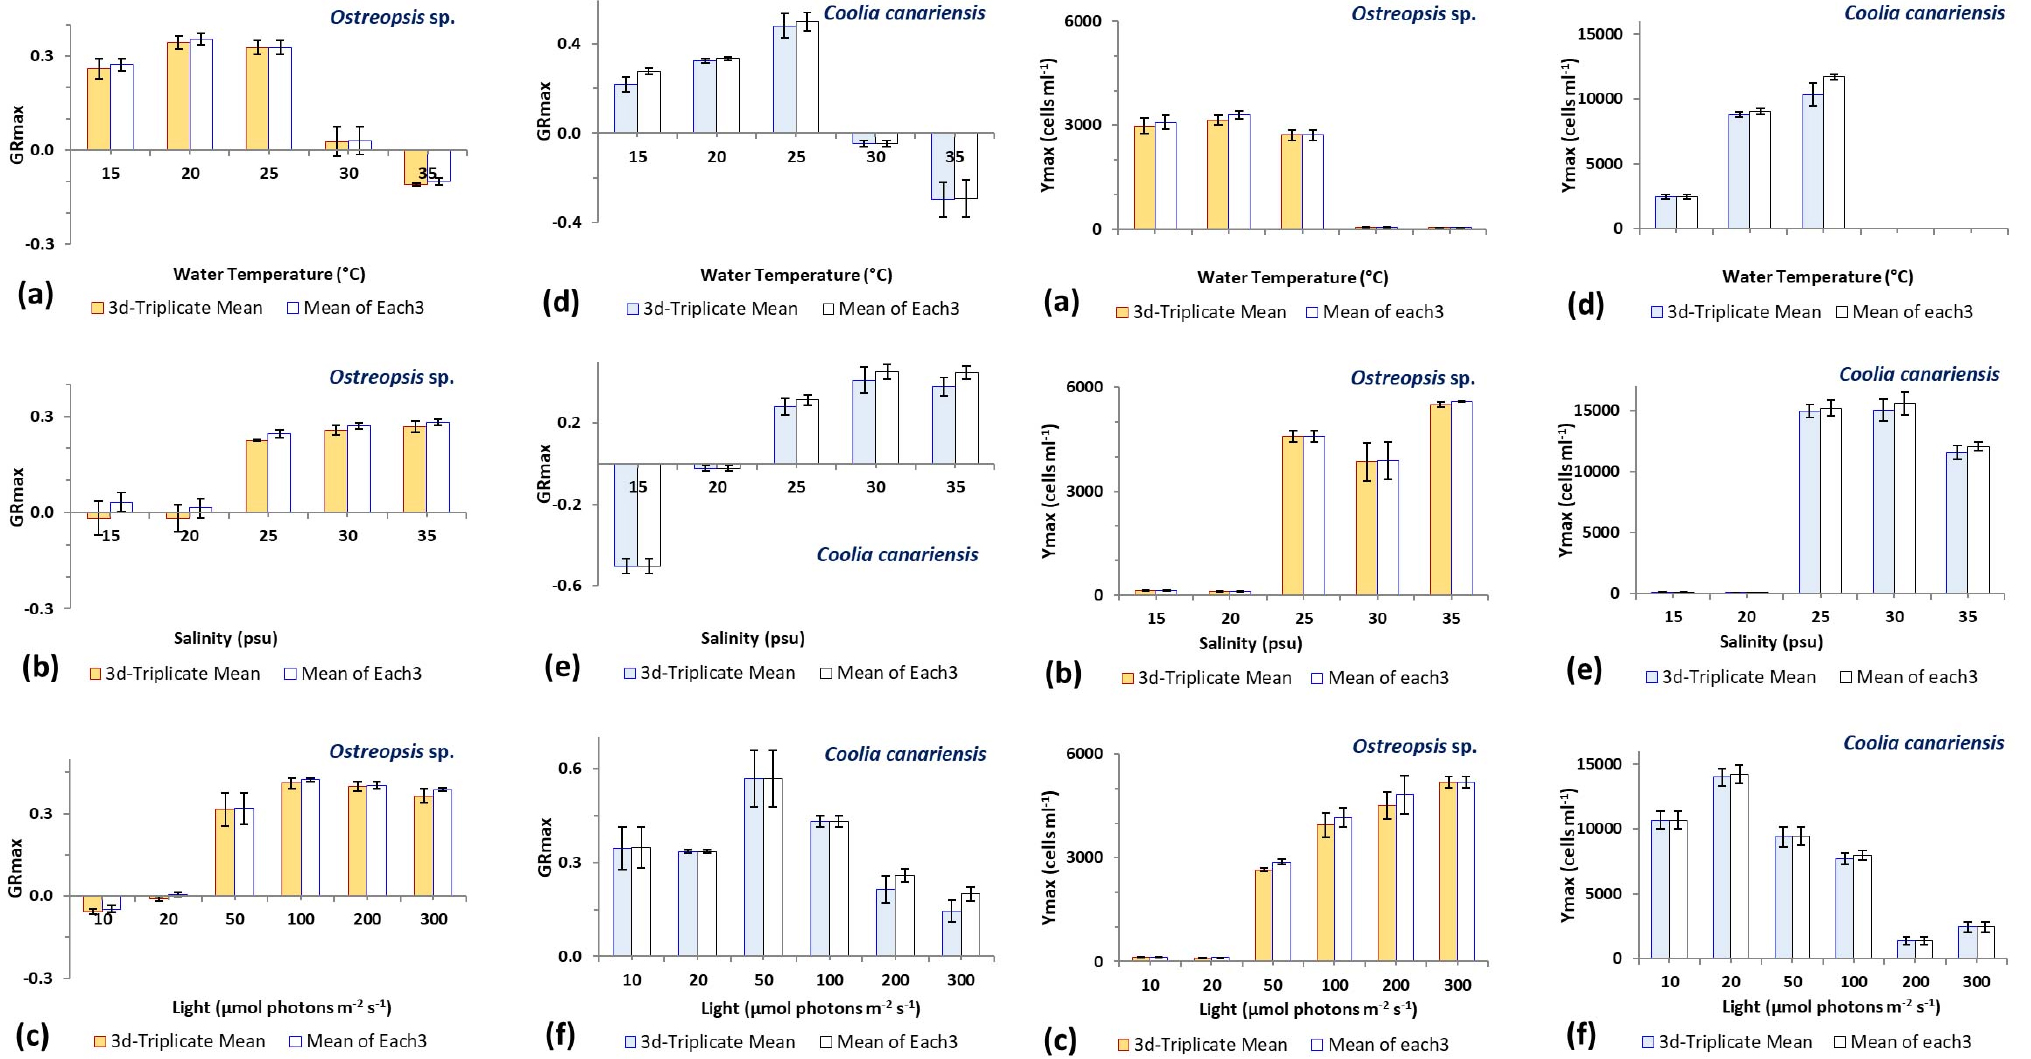
Fig. 5.
Maximum growth rate (GRmax) (six graphs on the left) and maximum biomass yields (Ymax) (six graphs on the right) of the epiphytic dinoflagellate strains Ostreopsis sp. (a–c) and C. canariensis (d–f) are plotted as a function of water temperature (a, d), salinity (b, e), and light intensity (c, f). GRmax is the maximum SDA-GR (4-day average daily specific growth rate). Bars in the six graphs on the left represent averages of three SDA-GR values (“3d-Triplicate Mean” GRmax) from each of the three series on the day with the maximum SDA-GR value out of the daily triplicate mean data (“Triplicate Mean”) or the average of the three maximum SDA-GR values obtained in each bottle data series (“Mean of each 3”). Bars in the six graphs on the right represent averages of the dinoflagellate abundance (“3d-Triplicate Mean” Ymax) in each of the three series on the day with Ymax out of the daily triplicate mean data or the averages of three Ymax values obtained in each bottle data series during a 34-day cultivation experiment. Error bars represent SE (standard error of the mean)
Table 1.
Results of comparing “Mean of Each” populations with “3d-Triplicate Mean” populations using the mean GRmax and Ymax values of Ostreopsis and Coolia strains. A two tailed t-test was performed under the assumption of equal variances to test the null hypothesis that the two means are equal. All P(T<=t) values (last column) are greater than 0.05
| Temperature | ||||||||||||||||||
| Osteropsis | Mean of Each3 | Osteropsis | 3d-Triplicate Mean | T.TEST** | ||||||||||||||
| T | GRmax1 | GRmax2 | GRmax3 | average | T | GRmax1 | GRmax2 | GRmax3 | average | P(T<=t) | ||||||||
| 15 | 0.236 | 0.278 | 0.304 | 0.2725 | 15 | 0.200 | 0.278 | 0.304 | 0.2605 | 0.7602 | ||||||||
| 20 | 0.352 | 0.386 | 0.326 | 0.3546 | 20 | 0.317 | 0.386 | 0.326 | 0.3429 | 0.6933 | ||||||||
| 25 | 0.344 | 0.284 | 0.354 | 0.3273 | 25 | 0.344 | 0.284 | 0.354 | 0.3273 | 1.0000 | ||||||||
| 30 | 0.113 | 0.019 | -0.041 | 0.0301 | 30 | 0.113 | 0.019 | -0.048 | 0.0278 | 0.9729 | ||||||||
| 35 | -0.079 | -0.101 | -0.118 | -0.0992 | 35 | -0.109 | -0.101 | -0.118 | -0.1092 | 0.4563 | ||||||||
| Coolia | Mean of Each3 | Coolia | 3d-Triplicate Mean | T.TEST | ||||||||||||||
| T | GRmax1 | GRmax2 | GRmax3 | average | T | GRmax1 | GRmax2 | GRmax3 | average | P(T<=t) | ||||||||
| 15 | 0.253 | 0.285 | 0.294 | 0.2774 | 15 | 0.176 | 0.285 | 0.200 | 0.2205 | 0.1830 | ||||||||
| 20 | 0.318 | 0.342 | 0.344 | 0.3349 | 20 | 0.318 | 0.313 | 0.344 | 0.3253 | 0.4922 | ||||||||
| 25 | 0.454 | 0.584 | 0.463 | 0.5002 | 25 | 0.401 | 0.584 | 0.463 | 0.4826 | 0.8087 | ||||||||
| 30 | -0.069 | -0.025 | -0.046 | -0.0465 | 30 | -0.069 | -0.025 | -0.046 | -0.0465 | 1.0000 | ||||||||
| 35 | -0.128 | -0.402 | -0.353 | -0.2943 | 35 | -0.142 | -0.402 | -0.353 | -0.2990 | 0.9693 | ||||||||
| Osteropsis | Mean of Each3 | Osteropsis | 3d-Triplicate Mean | T.TEST | ||||||||||||||
| T | Ymax1 | Ymax2 | Ymax3 | average | T | Ymax1 | Ymax2 | Ymax3 | average | P(T<=t) | ||||||||
| 15 | 3120 | 3400 | 2730 | 3083.3 | 15 | 3120 | 3310 | 2520 | 2983.3 | 0.7612 | ||||||||
| 20 | 3410 | 3400 | 3060 | 3290.0 | 20 | 3410 | 3050 | 2990 | 3150.0 | 0.4672 | ||||||||
| 25 | 3010 | 2490 | 2620 | 2706.7 | 25 | 3010 | 2490 | 2620 | 2706.7 | 1.0000 | ||||||||
| 30 | 88 | 56 | 49 | 64.3 | 30 | 88 | 56 | 33 | 59.0 | 0.8025 | ||||||||
| 35 | 51 | 50 | 48 | 49.7 | 35 | 51.0 | 42.0 | 48.0 | 47.0 | 0.3931 | ||||||||
| Coolia | Mean of Each3 | Coolia | 3d-Triplicate Mean | T.TEST | ||||||||||||||
| T | Ymax1 | Ymax2 | Ymax3 | average | T | Ymax1 | Ymax2 | Ymax3 | average | P(T<=t) | ||||||||
| 15 | 2645 | 2550 | 2160 | 2451.7 | 15 | 2645 | 2550 | 2160 | 2451.7 | 1.0000 | ||||||||
| 20 | 8683 | 8980 | 9440 | 9034.3 | 20 | 8367 | 8980 | 9040 | 8795.7 | 0.4814 | ||||||||
| 25 | 11750 | 12040 | 11300 | 11696.7 | 25 | 9467 | 12040 | 9530 | 10345.7 | 0.1972 | ||||||||
| 30 | 39 | 32 | 34 | 35.0 | 30 | 39.0 | 28.0 | 34.0 | 33.7 | 0.7434 | ||||||||
| 35 | 30 | 40 | 41 | 37.0 | 35 | 30.0 | 40.0 | 41.0 | 37.0 | 1.0000 | ||||||||
| Salinity | ||||||||||||||||||
| Osteropsis | Mean of Each3 | Osteropsis | 3d-Triplicate Mean | T.TEST | ||||||||||||||
| S | GRmax1 | GRmax2 | GRmax3 | average | S | GRmax1 | GRmax2 | GRmax3 | average | P(T<=t) | ||||||||
| 15 | -0.015 | 0.023 | 0.088 | 0.0319 | 15 | -0.065 | -0.076 | 0.088 | -0.0175 | 0.4608 | ||||||||
| 20 | -0.026 | -0.004 | 0.073 | 0.0146 | 20 | -0.026 | -0.086 | 0.059 | -0.0176 | 0.5664 | ||||||||
| 25 | 0.271 | 0.239 | 0.230 | 0.2465 | 25 | 0.221 | 0.223 | 0.230 | 0.2247 | 0.1619 | ||||||||
| 30 | 0.277 | 0.254 | 0.282 | 0.2708 | 30 | 0.234 | 0.254 | 0.282 | 0.2567 | 0.4354 | ||||||||
| 35 | 0.264 | 0.293 | 0.288 | 0.2816 | 35 | 0.230 | 0.285 | 0.288 | 0.2678 | 0.5421 | ||||||||
| Coolia | Mean of Each3 | Coolia | 3d-Triplicate Mean | T.TEST | ||||||||||||||
| S | GRmax1 | GRmax2 | GRmax3 | average | S | GRmax1 | GRmax2 | GRmax3 | average | P(T<=t) | ||||||||
| 15 | -0.461 | -0.576 | -0.476 | -0.5044 | 15 | -0.461 | -0.576 | -0.476 | -0.5044 | 1.0000 | ||||||||
| 20 | -0.029 | -0.041 | 0.005 | -0.0213 | 20 | -0.029 | -0.041 | 0.005 | -0.0213 | 1.0000 | ||||||||
| 25 | 0.275 | 0.361 | 0.306 | 0.3140 | 25 | 0.232 | 0.361 | 0.248 | 0.2801 | 0.5162 | ||||||||
| 30 | 0.422 | 0.521 | 0.413 | 0.4519 | 30 | 0.296 | 0.521 | 0.413 | 0.4099 | 0.5981 | ||||||||
| 35 | 0.405 | 0.508 | 0.429 | 0.4473 | 35 | 0.405 | 0.444 | 0.294 | 0.3809 | 0.2906 | ||||||||
| Osteropsis | Mean of Each3 | Osteropsis | 3d-Triplicate Mean | T.TEST | ||||||||||||||
| S | Ymax1 | Ymax2 | Ymax3 | average | S | Ymax1 | Ymax2 | Ymax3 | average | P(T<=t) | ||||||||
| 15 | 121 | 134 | 134 | 129.5 | 15 | 121 | 134 | 134 | 129.5 | 1.0000 | ||||||||
| 20 | 116 | 97 | 116 | 109.6 | 20 | 116 | 88 | 102 | 101.8 | 0.4816 | ||||||||
| 25 | 4330 | 4568 | 4874 | 4590.3 | 25 | 4330 | 4568 | 4874 | 4590.3 | 1.0000 | ||||||||
| 30 | 4868 | 3728 | 3040 | 3878.7 | 30 | 4868 | 3728 | 2940 | 3845.3 | 0.9677 | ||||||||
| 35 | 5633 | 5593 | 5551 | 5592.3 | 35 | 5364 | 5593 | 5551 | 5502.7 | 0.2938 | ||||||||
| Coolia | Mean of Each3 | Coolia | 3d-Triplicate Mean | T.TEST | ||||||||||||||
| S | Ymax1 | Ymax2 | Ymax3 | average | S | Ymax1 | Ymax2 | Ymax3 | average | P(T<=t) | ||||||||
| 15 | 110 | 89 | 97 | 98.7 | 15 | 110 | 89 | 97 | 98.7 | 1.0000 | ||||||||
| 20 | 86 | 91 | 98 | 91.8 | 20 | 85 | 91 | 96 | 90.7 | 0.8228 | ||||||||
| 25 | 16138 | 13987 | 15400 | 15174.8 | 25 | 15750 | 13987 | 15100 | 14945.7 | 0.7923 | ||||||||
| 30 | 16650 | 16333 | 13683 | 15555.3 | 30 | 16650 | 14700 | 13683 | 15011.0 | 0.6929 | ||||||||
| 35 | 12463 | 12266 | 11383 | 12037.2 | 35 | 12463 | 11600 | 10509 | 11523.7 | 0.4772 | ||||||||
| Light | ||||||||||||||||||
| Osteropsis | Mean of Each3 | Osteropsis | 3d-Triplicate Mean | T.TEST | ||||||||||||||
| L | GRmax1 | GRmax2 | GRmax3 | average | L | GRmax1 | GRmax2 | GRmax3 | average | P(T<=t) | ||||||||
| 10 | -0.073 | -0.039 | -0.031 | -0.0478 | 10 | -0.073 | -0.059 | -0.039 | -0.0573 | 0.5931 | ||||||||
| 20 | -0.005 | 0.000 | 0.022 | 0.0054 | 20 | -0.006 | 0.000 | -0.025 | -0.0106 | 0.2271 | ||||||||
| 50 | 0.278 | 0.432 | 0.245 | 0.3183 | 50 | 0.271 | 0.432 | 0.241 | 0.3146 | 0.9657 | ||||||||
| 100 | 0.430 | 0.429 | 0.411 | 0.4235 | 100 | 0.430 | 0.429 | 0.373 | 0.4109 | 0.5596 | ||||||||
| 200 | 0.429 | 0.386 | 0.393 | 0.4027 | 200 | 0.429 | 0.370 | 0.393 | 0.3974 | 0.8232 | ||||||||
| 300 | 0.398 | 0.381 | 0.383 | 0.3873 | 300 | 0.398 | 0.381 | 0.315 | 0.3645 | 0.4254 | ||||||||
| Coolia | Mean of Each3 | Coolia | 3d-Triplicate Mean | T.TEST | ||||||||||||||
| L | GRmax1 | GRmax2 | GRmax3 | average | L | GRmax1 | GRmax2 | GRmax3 | average | P(T<=t) | ||||||||
| 10 | 0.223 | 0.443 | 0.378 | 0.3482 | 10 | 0.213 | 0.443 | 0.378 | 0.3449 | 0.9741 | ||||||||
| 20 | 0.343 | 0.338 | 0.323 | 0.3345 | 20 | 0.343 | 0.338 | 0.322 | 0.3343 | 0.9869 | ||||||||
| 50 | 0.409 | 0.725 | 0.567 | 0.5670 | 50 | 0.409 | 0.725 | 0.567 | 0.5670 | 1.0000 | ||||||||
| 100 | 0.398 | 0.439 | 0.456 | 0.4307 | 100 | 0.398 | 0.439 | 0.456 | 0.4307 | 1.0000 | ||||||||
| 200 | 0.280 | 0.218 | 0.280 | 0.2591 | 200 | 0.228 | 0.135 | 0.280 | 0.2144 | 0.3980 | ||||||||
| 300 | 0.183 | 0.241 | 0.173 | 0.1989 | 300 | 0.090 | 0.212 | 0.133 | 0.1450 | 0.2634 | ||||||||
| Osteropsis | Mean of Each3 | Osteropsis | 3d-Triplicate Mean | T.TEST | ||||||||||||||
| L | Ymax1 | Ymax2 | Ymax3 | average | L | Ymax1 | Ymax2 | Ymax3 | average | P(T<=t) | ||||||||
| 10 | 94 | 116 | 134 | 115 | 10 | 94 | 116 | 134 | 115 | 1.0000 | ||||||||
| 20 | 97 | 129 | 114 | 113 | 20 | 97 | 129 | 106 | 111 | 0.8506 | ||||||||
| 50 | 2995 | 2871 | 2766 | 2877 | 50 | 2565 | 2625 | 2766 | 2652 | 0.0648 | ||||||||
| 100 | 4718 | 3845 | 3910 | 4158 | 100 | 4598 | 3845 | 3395 | 3946 | 0.6622 | ||||||||
| 200 | 5442 | 3716 | 5308 | 4822 | 200 | 4850 | 3716 | 4938 | 4501 | 0.6618 | ||||||||
| 300 | 4865 | 5281 | 5408 | 5185 | 300 | 4865 | 5281 | 5408 | 5185 | 1.0000 | ||||||||
| Coolia | Mean of Each3 | Coolia | 3d-Triplicate Mean | T.TEST | ||||||||||||||
| L | Ymax1 | Ymax2 | Ymax3 | average | L | Ymax1 | Ymax2 | Ymax3 | average | P(T<=t) | ||||||||
| 10 | 9317 | 11450 | 11250 | 10672 | 10 | 9317 | 11450 | 11250 | 10672 | 1.0000 | ||||||||
| 20 | 14933 | 14907 | 12833 | 14224 | 20 | 14933 | 14237 | 12750 | 13973 | 0.8043 | ||||||||
| 50 | 10500 | 9800 | 8087 | 9462 | 50 | 10500 | 9800 | 7868 | 9389 | 0.9486 | ||||||||
| 100 | 7317 | 8616 | 8000 | 7977 | 100 | 7117 | 8616 | 7366 | 7700 | 0.6657 | ||||||||
| 200 | 1920 | 943 | 1340 | 1401 | 200 | 1920 | 943 | 1340 | 1401 | 1.0000 | ||||||||
| 300 | 2285 | 3225 | 1820 | 2443 | 300 | 2285 | 3225 | 1820 | 2443 | 1.0000 | ||||||||
4. Conclusion
Maximum growth rate and maximum biomass yield
Neither maximum growth rate (GRmax) nor maximum biomass yield (Ymax) exhibited statistically significant differences between the two calculation methods, one based on three sets of daily population per bottle and the other based on average daily population from triplicate bottles (“Mean of Each 3” and “Triplicate Mean”, Fig. 4). Therefore, the null hypothesis (H₀) was not rejected, and both the calculation methods yielded comparable GRmax or Ymax estimates for the two Korean strains with statistically insignificant difference at a 95% confidence level. And it is likely that the same results will be obtained in other similar replicate experiments using EPD strains under the same environmental conditions in this study.
Dispersion in time-to-peak data sets for GRmax and Ymax
The “Mean of Each 3” and “Triplicate Mean” data sets were highly congruent for both GRmax (Fig. 2a–f of the six graphs on the left) or Ymax (Fig. 3a–f of the six graphs on the left) across all the T, S, and L experiments. However, this alignment did not consistently extend to the elapsed days required to reach GRmax (Fig. 2a–f of the six graphs on the right) and Ymax (Fig. 3a–f of the six graphs on the right). Linear regression of T-S-L-pooled elapsed days revealed lower correlation coefficients for the time to reach GRmax (with 0.867 < R2 < 0.897; Fig. 4b and d of the four graphs on the left) compared to the time to reach Ymax (with 0.964 < R2 < 0.992; Fig. 4b and d of the four graphs on the right). Thus, the two calculation methods produced more pronounced discrepancies in the elapsed days to reach GRmax than in the days to reach Ymax.
Quantifying the level of synchronization among three replicate cultures
In conclusion, performing linear regression analysis to determine correlation coefficients or the coefficients of determination (R2) on similar data sets offers a reliable method to numerically express culture synchronization. This mathematical approach explicitly quantifies the level of chronological synchronization among triplicate cultures in laboratory experiments using EPD strains. The most sensitive metrics for identifying subtle desynchronization are the elapsed days to reach physiological milestones, rather than the absolute GRmax or Ymax themselves.
Furthermore, the difference between the average maximum growth rate calculated per individual bottle and the maximum growth rate derived from the daily average population time series was statistically insignificant at a 95% confidence level. The synchronization level of theses triplicate EPD cultures can be robustly indicated by correlation coefficients or R2 values obtained from linear regression between the individual replicate data sets and the pooled triplicate mean, particularly when analyzing the days required to reach GRmax.